
• Attention Forex Brokers, FX Companies & Hedge Funds.

    forum.forex is available for Acquisition (quick sale)

    Submit your Offer

Daily Market Analytics - Forex

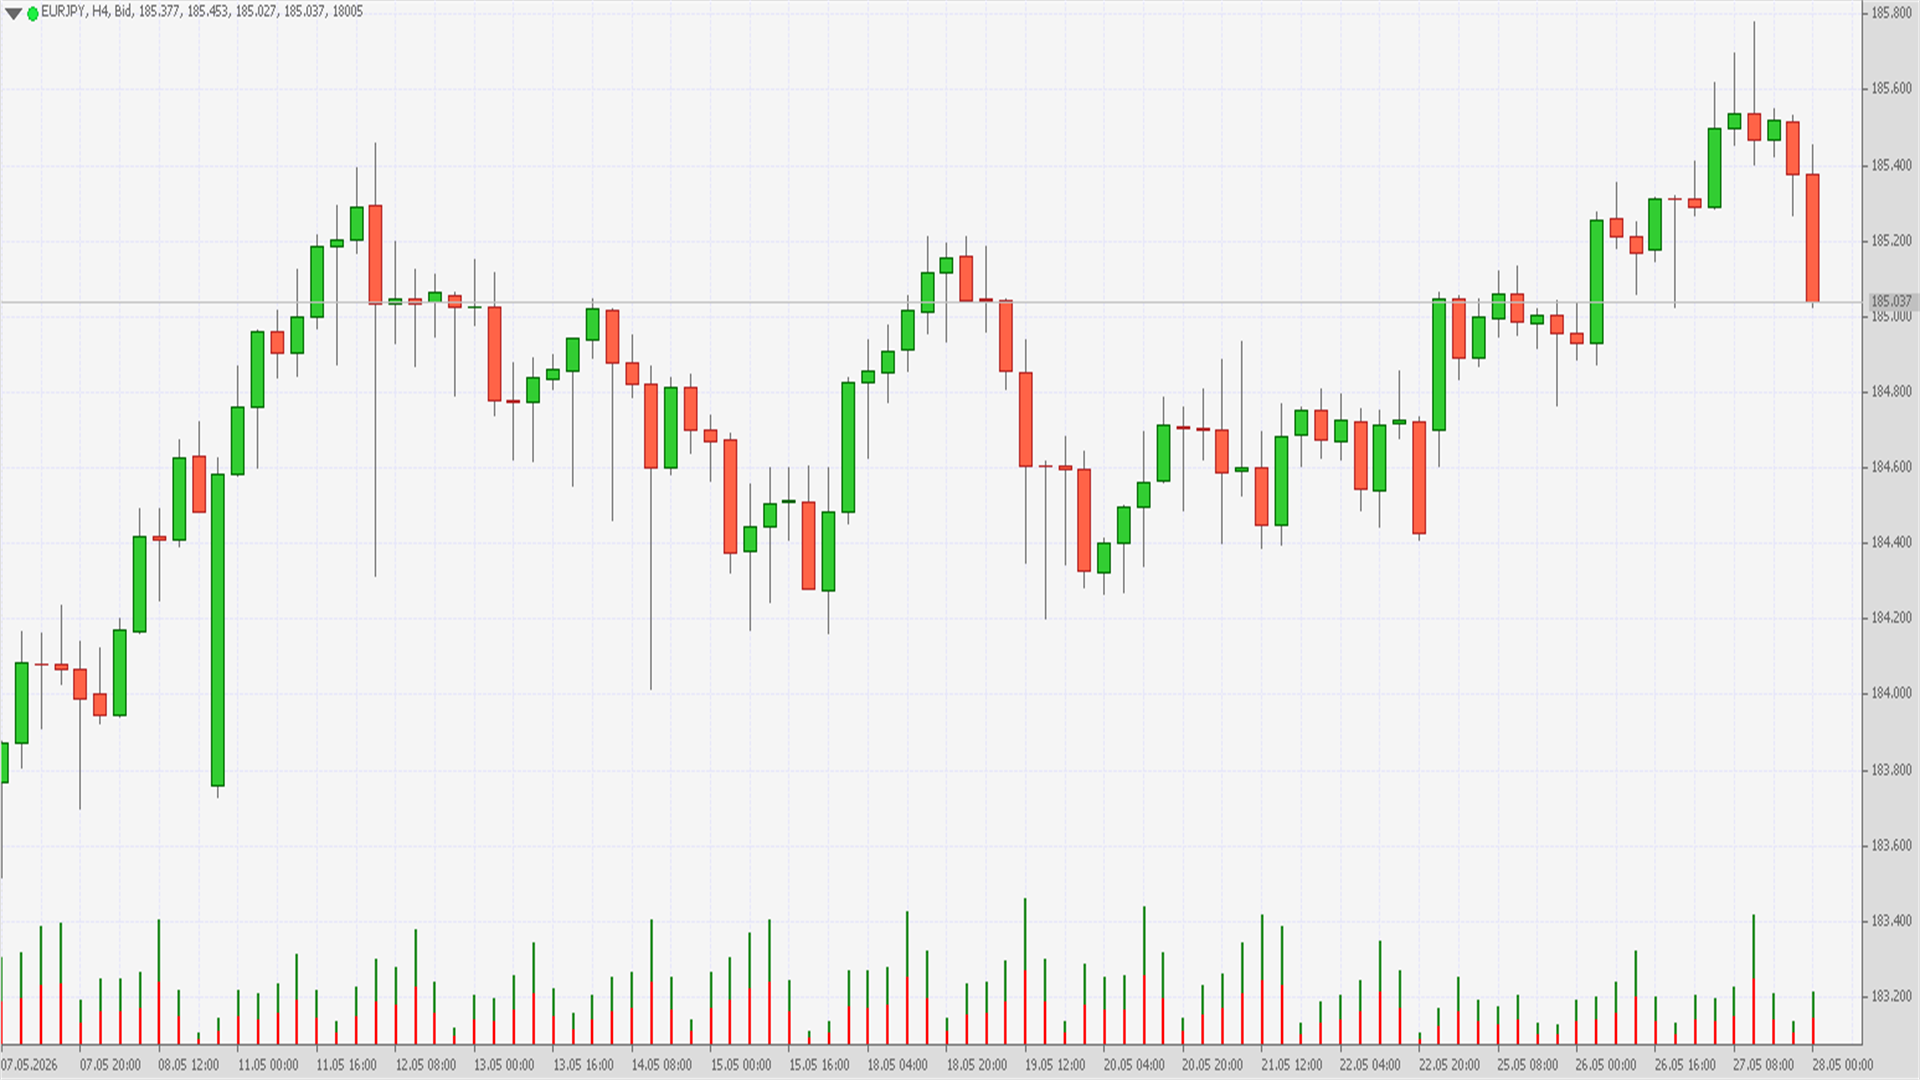
EURJPY Technical Analysis – 25 MAY, 2026
EURJPY – On 25 May 2026, the Euro against the Japanese Yen (EURJPY) registered a significant low at 184.40
yol93L3e_o.png


Technical Analysis: EURJPY – Low 184.40 (25 May 2026)

On 25 May 2026, the Euro against the Japanese Yen (EURJPY) registered a significant low at 184.40, marking a pivotal support level in the pair’s medium-term trajectory. This level is technically important because it represents a continuation of the corrective phase that has been unfolding since the prior session’s rejection near 185.20. The move toward 184.40 underscores the importance of this threshold in determining whether EURJPY can stabilize or extend its decline.

Price action leading into this low was characterized by a gradual retreat from the 185.00 resistance zone, which had capped gains earlier in the week. Sellers regained control, driving the pair lower in a sequence of lower highs and lower lows. The decline toward 184.40 illustrates the vulnerability of the Euro in the current environment. This low now serves as immediate support. A sustained break beneath 184.40 would expose the next downside target at 183.50, while a rebound from this level could initiate a corrective rally back toward 185.20.

Technical indicators confirm the bearish bias. The 50-day moving average, currently positioned near 186.00, has begun to flatten, reflecting short-term weakness. The 200-day moving average, hovering around 180.00, remains below current price action, suggesting that the longer-term trend is still bullish but vulnerable to deeper corrections. Momentum readings, particularly the Relative Strength Index (RSI), have dipped toward 43, indicating bearish pressure but not yet oversold conditions. This suggests that further downside remains possible before buyers regain control.

From a fundamental perspective, the Euro has been pressured by uneven growth across the Eurozone, with industrial output and consumer confidence showing signs of strain. The Japanese Yen, meanwhile, has benefited modestly from safe-haven demand as global equity markets experienced volatility in May. However, the Bank of Japan’s continued accommodative stance has limited the Yen’s ability to mount a sustained rally. Interest rate differentials remain firmly in favour of the Euro, which explains why EURJPY has remained elevated despite short-term corrections.

Looking ahead, the market outlook for EURJPY depends on whether buyers can defend the 184.40 low. A daily close below this level would likely accelerate bearish momentum, targeting 183.50 and potentially 182.00 in extension. Conversely, if buyers manage to reclaim ground above 185.20, the pair could attempt a corrective rally toward 186.50, though strong resistance is expected at that level. Traders should closely monitor Eurozone economic releases and Bank of Japan commentary, as these will heavily influence the pair’s trajectory.

In summary, the 184.40 low represents a pivotal support zone for EURJPY. While the longer-term trend remains bullish, the short-term outlook is tilted to the downside. Unless Eurozone fundamentals improve or risk appetite strengthens, the Yen’s safe-haven appeal may continue to dominate, keeping EURJPY under pressure and reinforcing the corrective phase.

#fxopen #forex #forexanalysis

Disclaimer: This analysis represents my own opinion only. It is not to be construed as an opinion, offer, solicitation, recommendation, or financial advice of the Companies operating under the FXOpen brand.

For in-depth analysis, please check ...
 
EURUSD Technical Analysis – 25 MAY, 2026
EURUSD – On 25 May 2026, the Euro against the U.S. Dollar (EURUSD) registered a significant low at 1.1588

ZOkEUUnJ_o.png


Technical Analysis: EURUSD – Low 1.1588 (25 May 2026)

On 25 May 2026, the Euro against the U.S. Dollar (EURUSD) registered a significant low at 1.1588, marking a pivotal support level in the pair’s medium-term trajectory. This level is technically important because it represents a continuation of the corrective phase that has been unfolding since the prior session’s rejection near 1.1630. The move toward 1.1588 underscores the importance of this threshold in determining whether EURUSD can stabilize or extend its decline.

Price action leading into this low was characterized by a gradual retreat from the 1.1630 resistance zone, which had capped gains earlier in the week. Sellers regained control, driving the pair lower in a sequence of lower highs and lower lows. The decline toward 1.1588 illustrates the vulnerability of the Euro in the current environment. This low now serves as immediate support. A sustained break beneath 1.1588 would expose the next downside target at 1.1550, while a rebound from this level could initiate a corrective rally back toward 1.1630.

Technical indicators confirm the bearish bias. The 50-day moving average, currently positioned near 1.1525, is trending upward but now intersecting with price action, suggesting a potential battle between buyers and sellers. The 200-day moving average, hovering around 1.1400, remains below current price action, underscoring the longer-term bullish trajectory. Momentum readings, particularly the Relative Strength Index (RSI), have dipped toward 46, indicating bearish pressure but not yet oversold conditions. This suggests that further downside remains possible before buyers regain control.

From a fundamental perspective, the Euro has been pressured by uneven growth across the Eurozone, with industrial output and consumer confidence showing signs of strain. The U.S. Dollar, meanwhile, continues to benefit from elevated Treasury yields and expectations of a hawkish Federal Reserve stance. Interest rate differentials remain firmly in favour of the USD, reinforcing its strength against EUR. Additionally, global risk sentiment has been fragile, with equity market volatility limiting appetite for growth-sensitive currencies like the Euro. This dynamic explains why EURUSD remains capped below the 1.1630 resistance despite occasional rebounds.

Looking ahead, the market outlook for EURUSD depends on whether buyers can defend the 1.1588 low. A daily close below this level would likely accelerate bearish momentum, targeting 1.1550 and potentially 1.1500 in extension. Conversely, if buyers manage to reclaim ground above 1.1630, the pair could attempt a corrective rally toward 1.1700, though strong resistance is expected at that level. Traders should closely monitor Eurozone economic releases and U.S. monetary policy signals, as these will heavily influence the pair’s trajectory.

In summary, the 1.1588 low represents a pivotal support zone for EURUSD. While the longer-term trend remains bullish, the short-term outlook is tilted to the downside. Unless Eurozone fundamentals improve or risk appetite strengthens, the Dollar’s strength may continue to dominate, keeping EURUSD under pressure and reinforcing the corrective phase.

#fxopen #forex #forexanalysis

Disclaimer: This analysis represents my own opinion only. It is not to be construed as an opinion, offer, solicitation, recommendation, or financial advice of the Companies operating under the FXOpen brand.

For in-depth analysis, please check ...
 
GBPJPY Technical Analysis – 25 MAY, 2026
GBPJPY – On 25 May 2026, the British Pound against the Japanese Yen (GBPJPY) registered a significant high at 214.02

RiTKNatl_o.png


Technical Analysis: GBPJPY – High 214.02 (25 May 2026)

On 25 May 2026, the British Pound against the Japanese Yen (GBPJPY) registered a significant high at 214.02, marking a pivotal resistance level in the pair’s medium-term trajectory. This level is technically important because it represents a continuation of the bullish momentum that has been building since mid-May, when the pair rebounded from the 212.00 support zone. The move toward 214.02 underscores the importance of this threshold in determining whether GBPJPY can sustain its rally or enter a corrective phase.

Price action leading into this high was characterized by a steady climb from the 212.50 support zone, which had held firm during the prior week. The rally was supported by a sequence of higher intraday lows, reflecting the presence of buyers and reinforcing the bullish bias. However, the rejection at 214.02 indicates that sellers remain active at higher levels, preventing a decisive breakout. This high now serves as immediate resistance. A sustained close above 214.02 would open the path toward 215.50, while failure to breach this level could trigger a corrective pullback toward 212.50.

Technical indicators provide further insight into the pair’s dynamics. The 50-day moving average, currently positioned near 213.00, is trending upward, reflecting short-term strength. The 200-day moving average, hovering around 208.00, remains well below current price action, underscoring the longer-term bullish trajectory. Momentum readings, particularly the Relative Strength Index (RSI), have climbed toward 66, indicating strong bullish momentum but approaching overbought conditions. This suggests that while further upside is possible, caution is warranted as the pair nears resistance.

From a fundamental perspective, the British Pound has been supported by expectations of continued monetary tightening from the Bank of England, as inflationary pressures remain elevated in the UK economy. The Japanese Yen, meanwhile, has been pressured by the Bank of Japan’s accommodative stance, which has kept yields low and reduced its appeal relative to the Pound. Although the Yen retains its safe-haven status, global risk sentiment has been sufficiently stable to limit demand for defensive assets, further disadvantaging JPY. Interest rate differentials remain firmly in favour of GBP, reinforcing its strength against JPY.

Looking forward, the market outlook for GBPJPY hinges on whether buyers can overcome the 214.02 resistance. A daily close above this level would likely accelerate bullish momentum, targeting 215.50 and potentially 218.00 in extension. Conversely, failure to break higher could invite renewed selling, with immediate support at 212.50 and deeper support at 210.50. Traders should closely monitor UK economic releases and Bank of Japan commentary, as these will heavily influence the pair’s trajectory.

In summary, the 214.02 high represents a pivotal resistance zone for GBPJPY. While the short-term trend shows strength, the longer-term outlook depends on whether the Pound can sustain momentum against the Yen. Unless global risk sentiment shifts sharply in favour of JPY or UK fundamentals weaken, the pair may continue to favour the upside, with the potential for further gains if resistance at 214.02 is decisively breached.

#fxopen #forex #forexanalysis

Disclaimer: This analysis represents my own opinion only. It is not to be construed as an opinion, offer, solicitation, recommendation, or financial advice of the Companies operating under the FXOpen brand.

For in-depth analysis, please check ...
 
GBPUSD Technical Analysis – 25 MAY, 2026
GBPUSD – On 25 May 2026, the British Pound against the U.S. Dollar (GBPUSD) registered a significant high at 1.3462

ZmwfuC0c_o.png


Technical Analysis: GBPUSD – High 1.3462 (25 May 2026)

On 25 May 2026, the British Pound against the U.S. Dollar (GBPUSD) registered a significant high at 1.3462, marking a pivotal resistance level in the pair’s medium-term trajectory. This level is technically important because it represents a continuation of the bullish momentum that has been building since mid-May, when the pair rebounded from the 1.3380 support zone. The move toward 1.3462 underscores the importance of this threshold in determining whether GBPUSD can sustain its rally or enter a corrective phase.

Price action leading into this high was characterized by a steady climb from the 1.3400 support zone, which had held firm during the prior week. The rally was supported by a sequence of higher intraday lows, reflecting the presence of buyers and reinforcing the bullish bias. However, the rejection at 1.3462 indicates that sellers remain active at higher levels, preventing a decisive breakout. This high now serves as immediate resistance. A sustained close above 1.3462 would open the path toward 1.3550, while failure to breach this level could trigger a corrective pullback toward 1.3400.

Technical indicators provide further insight into the pair’s dynamics. The 50-day moving average, currently positioned near 1.3440, is trending upward, reflecting short-term strength. The 200-day moving average, hovering around 1.3600, remains above current price action, underscoring the longer-term bearish trajectory. Momentum readings, particularly the Relative Strength Index (RSI), have climbed toward 64, indicating strong bullish momentum but approaching overbought conditions. This suggests that while further upside is possible, caution is warranted as the pair nears resistance.

From a fundamental perspective, the British Pound has been supported by expectations of continued monetary tightening from the Bank of England, as inflationary pressures remain elevated in the UK economy. The U.S. Dollar, meanwhile, has softened slightly as markets reassess the Federal Reserve’s policy stance. While Treasury yields remain elevated, expectations of a slower pace of tightening have reduced USD demand. Additionally, global risk sentiment has improved, favouring the Pound as investors rotate into growth-sensitive assets. This dynamic explains why GBPUSD has been able to push toward the 1.3462 resistance despite the Dollar’s underlying strength.

Looking forward, the market outlook for GBPUSD hinges on whether buyers can overcome the 1.3462 resistance. A daily close above this level would likely accelerate bullish momentum, targeting 1.3550 and potentially 1.3600 in extension. Conversely, failure to break higher could invite renewed selling, with immediate support at 1.3400 and deeper support at 1.3380. Traders should closely monitor UK inflation data, Bank of England commentary, and U.S. monetary policy signals, as these will heavily influence the pair’s trajectory.

In summary, the 1.3462 high represents a pivotal resistance zone for GBPUSD. While the short-term trend shows strength, the longer-term outlook depends on whether the Pound can sustain momentum against the Dollar. Unless U.S. yields rise sharply or UK fundamentals weaken, the pair may continue to favour the upside, with the potential for further gains if resistance at 1.3462 is decisively breached.

#fxopen #forex #forexanalysis

Disclaimer: This analysis represents my own opinion only. It is not to be construed as an opinion, offer, solicitation, recommendation, or financial advice of the Companies operating under the FXOpen brand.

For in-depth analysis, please check ...
 
NZDUSD Technical Analysis – 25 MAY, 2026
NZDUSD – On 25 May 2026, the New Zealand Dollar against the U.S. Dollar (NZDUSD) registered a significant low at 0.5834

lwywMzEh_o.png


Technical Analysis: NZDUSD – Low 0.5834 (25 May 2026)

On 25 May 2026, the New Zealand Dollar against the U.S. Dollar (NZDUSD) registered a significant low at 0.5834, marking a pivotal support level in the pair’s medium-term trajectory. This level is technically important because it represents a continuation of the corrective phase that has been unfolding since the prior session’s rejection near 0.5885. The move toward 0.5834 underscores the importance of this threshold in determining whether NZDUSD can stabilize or extend its decline.

Price action leading into this low was characterized by a gradual retreat from the 0.5880 resistance zone, which had capped gains earlier in the week. Sellers regained control, driving the pair lower in a sequence of lower highs and lower lows. The decline toward 0.5834 illustrates the vulnerability of the New Zealand Dollar in the current environment. This low now serves as immediate support. A sustained break beneath 0.5834 would expose the next downside target at 0.5800, while a rebound from this level could initiate a corrective rally back toward 0.5880.

Technical indicators confirm the bearish bias. The 50-day moving average, currently positioned near 0.5900, has begun to flatten, reflecting short-term weakness. The 200-day moving average, hovering around 0.6100, remains above current price action, suggesting that the longer-term trend is still consolidative rather than decisively bearish. Momentum readings, particularly the Relative Strength Index (RSI), have dipped toward 42, indicating bearish pressure but not yet oversold conditions. This suggests that further downside remains possible before buyers regain control.

From a fundamental perspective, the New Zealand Dollar has been pressured by subdued commodity demand, particularly dairy exports, which remain central to New Zealand’s trade balance. Global growth concerns and weaker demand from China have further weighed on NZD sentiment. The U.S. Dollar, meanwhile, continues to benefit from elevated Treasury yields and expectations of a hawkish Federal Reserve stance. Interest rate differentials remain firmly in favour of the USD, reinforcing its strength against NZD. Additionally, global risk sentiment has been fragile, with equity market volatility limiting appetite for risk-sensitive currencies like the New Zealand Dollar.

Looking ahead, the market outlook for NZDUSD depends on whether buyers can defend the 0.5834 low. A daily close below this level would likely accelerate bearish momentum, targeting 0.5800 and potentially 0.5750 in extension. Conversely, if buyers manage to reclaim ground above 0.5880, the pair could attempt a corrective rally toward 0.5950, though strong resistance is expected at that level. Traders should closely monitor New Zealand’s export data, commodity price trends, and U.S. monetary policy signals, as these will heavily influence the pair’s trajectory.

In summary, the 0.5834 low represents a pivotal support zone for NZDUSD. While the longer-term trend remains consolidative, the short-term outlook is tilted to the downside. Unless New Zealand’s fundamentals improve or risk appetite strengthens, the Dollar’s strength may continue to dominate, keeping NZDUSD under pressure and reinforcing the corrective phase.

#fxopen #forex #forexanalysis

Disclaimer: This analysis represents my own opinion only. It is not to be construed as an opinion, offer, solicitation, recommendation, or financial advice of the Companies operating under the FXOpen brand.

For in-depth analysis, please check ...
 
USDCAD Technical Analysis – 25 MAY, 2026
USDCAD – On 25 May 2026, the U.S. Dollar against the Canadian Dollar (USDCAD) registered a significant high at 1.3802

rUcU568z_o.png


Technical Analysis: USDCAD – High 1.3802 (25 May 2026)

On 25 May 2026, the U.S. Dollar against the Canadian Dollar (USDCAD) registered a significant high at 1.3802, marking a pivotal resistance level in the pair’s medium-term trajectory. This level is technically important because it represents a continuation of the bullish momentum that has been building since early May, when the pair rebounded from the 1.3680 support zone. The move toward 1.3802 underscores the importance of this threshold in determining whether USDCAD can sustain its rally or enter a corrective phase.

Price action leading into this high was characterized by a steady climb supported by a sequence of higher lows, reflecting the presence of buyers and reinforcing the bullish bias. The rejection at 1.3802, however, indicates that sellers remain active at higher levels, preventing a decisive breakout. This high now serves as immediate resistance. A sustained close above 1.3802 would open the path toward 1.3850, while failure to breach this level could trigger a corrective pullback toward 1.3700.

Technical indicators provide further insight into the pair’s dynamics. The 50-day moving average, currently positioned near 1.3660, is trending upward, reflecting short-term strength. The 200-day moving average, hovering around 1.3500, remains well below current price action, underscoring the longer-term bullish trajectory. Momentum readings, particularly the Relative Strength Index (RSI), have climbed toward 68, indicating strong bullish momentum but approaching overbought conditions. This suggests that while further upside is possible, caution is warranted as the pair nears resistance.

From a fundamental perspective, the U.S. Dollar has been supported by elevated Treasury yields and expectations of a hawkish Federal Reserve stance. Interest rate differentials remain firmly in favor of the USD, reinforcing its strength against CAD. The Canadian Dollar, meanwhile, has been pressured by softer crude oil prices, which are central to Canada’s export profile and fiscal health. Weakness in energy markets has translated into reduced demand for CAD, while domestic economic indicators have shown signs of strain. Additionally, global risk sentiment has been fragile, further disadvantaging the Canadian Dollar relative to the U.S. Dollar.

Looking forward, the market outlook for USDCAD hinges on whether buyers can overcome the 1.3802 resistance. A daily close above this level would likely accelerate bullish momentum, targeting 1.3850 and potentially 1.3900 in extension. Conversely, failure to break higher could invite renewed selling, with immediate support at 1.3700 and deeper support at 1.3680. Traders should closely monitor U.S. monetary policy signals and crude oil price movements, as these will heavily influence the pair’s trajectory.

In summary, the 1.3802 high represents a pivotal resistance zone for USDCAD. While the short-term trend shows strength, the longer-term outlook depends on whether the Dollar can sustain momentum against the Canadian Dollar. Unless oil prices rebound or U.S. yields soften, the pair may continue to favour the upside, with the potential for further gains if resistance at 1.3802 is decisively breached.

#fxopen #forex #forexanalysis

Disclaimer: This analysis represents my own opinion only. It is not to be construed as an opinion, offer, solicitation, recommendation, or financial advice of the Companies operating under the FXOpen brand.

For in-depth analysis, please check ...
 
USDCHF Technical Analysis – 25 MAY, 2026
USDCHF – On 25 May 2026, the U.S. Dollar against the Swiss Franc (USDCHF) registered a significant low at 0.7838

ktbU72GL_o.png


Technical Analysis: USDCHF – Low 0.7838 (25 May 2026)

On 25 May 2026, the U.S. Dollar against the Swiss Franc (USDCHF) registered a significant low at 0.7838, marking a pivotal support level in the pair’s medium-term trajectory. This level is technically important because it represents a continuation of the corrective phase that has been unfolding since the prior session’s rejection near 0.7900. The move toward 0.7838 underscores the importance of this threshold in determining whether USDCHF can stabilize or extend its decline.

Price action leading into this low was characterized by a gradual retreat from the 0.7900 resistance zone, which had capped gains earlier in the week. Sellers regained control, driving the pair lower in a sequence of lower highs and lower lows. The decline toward 0.7838 illustrates the vulnerability of the Dollar in the current environment. This low now serves as immediate support. A sustained break beneath 0.7838 would expose the next downside target at 0.7800, while a rebound from this level could initiate a corrective rally back toward 0.7900.

Technical indicators confirm the bearish bias. The 50-day moving average, currently positioned near 0.7780, is trending upward but now intersecting with price action, suggesting a potential battle between buyers and sellers. The 200-day moving average, hovering around 0.7650, remains below current price action, underscoring the longer-term bullish trajectory. Momentum readings, particularly the Relative Strength Index (RSI), have dipped toward 45, indicating bearish pressure but not yet oversold conditions. This suggests that further downside remains possible before buyers regain control.

From a fundamental perspective, the U.S. Dollar has softened slightly as markets reassess the Federal Reserve’s policy stance. While Treasury yields remain elevated, expectations of a slower pace of tightening have reduced USD demand. The Swiss Franc, meanwhile, has benefited from safe-haven demand as global equity markets experienced volatility in May. Although the Swiss National Bank continues to maintain a cautious stance on monetary policy, the Franc’s defensive appeal has outweighed yield considerations in the short term. This dynamic explains why USDCHF remains capped below the 0.7900 resistance despite occasional rebounds.

Looking ahead, the market outlook for USDCHF depends on whether buyers can defend the 0.7838 low. A daily close below this level would likely accelerate bearish momentum, targeting 0.7800 and potentially 0.7750 in extension. Conversely, if buyers manage to reclaim ground above 0.7900, the pair could attempt a corrective rally toward 0.8000, though strong resistance is expected at that level. Traders should closely monitor U.S. monetary policy signals and Swiss National Bank commentary, as these will heavily influence the pair’s trajectory.

In summary, the 0.7838 low represents a pivotal support zone for USDCHF. While the longer-term trend remains bullish, the short-term outlook is tilted to the downside. Unless global risk sentiment shifts sharply in favour of the Dollar or U.S. yields rise further, the Franc’s safe-haven appeal may continue to dominate, keeping USDCHF under pressure and reinforcing the corrective phase.

#fxopen #forex #forexanalysis

Disclaimer: This analysis represents my own opinion only. It is not to be construed as an opinion, offer, solicitation, recommendation, or financial advice of the Companies operating under the FXOpen brand.

For in-depth analysis, please check ...
 
USDJPY Technical Analysis – 25 MAY, 2026
USDJPY - On 25 May 2026, the U.S. Dollar against the Japanese Yen (USDJPY) registered a significant high at 159.20

may5ajs4_o.png


Technical Analysis: USDJPY – High 159.20 (25 May 2026)

On 25 May 2026, the U.S. Dollar against the Japanese Yen (USDJPY) registered a significant high at 159.20, marking one of the strongest points for the pair in recent months. This level is technically important because it represents a continuation of the bullish momentum that has been building since March, driven by sustained U.S. Dollar strength and relative weakness in the Yen. The move toward 159.20 underscores the importance of this threshold in determining whether USDJPY can sustain its rally or enter a corrective phase.

Price action leading into this high was characterized by a steady climb from the 156.00 support zone, which had held firm through late April. The rally was supported by a sequence of higher lows, confirming the presence of buyers and reinforcing the bullish bias. However, the rejection at 159.20 indicates that sellers remain active at higher levels, preventing a decisive breakout. This high now serves as immediate resistance. A sustained close above 159.20 would open the path toward 160.50, while failure to breach this level could trigger a corrective pullback toward 157.50.

Technical indicators reinforce the bullish outlook. The 50-day moving average, currently positioned near 157.30, is trending upward, reflecting short-term strength. The 200-day moving average, hovering around 150.00, remains well below current price action, underscoring the longer-term bullish trajectory. Momentum readings, particularly the Relative Strength Index (RSI), have climbed toward 68, suggesting strong bullish momentum but approaching overbought territory. This implies that while further upside is possible, caution is warranted as the pair nears resistance.

From a fundamental perspective, the U.S. Dollar has been supported by elevated Treasury yields and expectations of a hawkish Federal Reserve stance. Interest rate differentials remain firmly in favour of the USD, reinforcing its strength against JPY. The Japanese Yen, meanwhile, has been pressured by the Bank of Japan’s continued accommodative stance, which has kept yields low and reduced its appeal relative to the Dollar. Although the Yen retains its safe-haven status, global risk sentiment has been sufficiently stable to limit demand for defensive assets, further disadvantaging JPY.

Looking ahead, the market outlook for USDJPY hinges on whether buyers can overcome the 159.20 resistance. A daily close above this level would likely accelerate bullish momentum, targeting 160.50 and potentially 162.00 in extension. Conversely, failure to break higher could invite renewed selling, with immediate support at 157.50 and deeper support at 156.00. Traders should closely monitor U.S. monetary policy signals and Bank of Japan commentary, as these will heavily influence the pair’s trajectory.

In summary, the 159.20 high represents a pivotal resistance zone for USDJPY. While the short-term trend shows strength, the longer-term outlook depends on whether the Dollar can sustain momentum against the Yen. Unless global risk sentiment shifts sharply in favour of JPY or U.S. yields soften, the pair may continue to favour the upside, with the potential for further gains if resistance at 159.20 is decisively breached.

#fxopen #forex #forexanalysis

Disclaimer: This analysis represents my own opinion only. It is not to be construed as an opinion, offer, solicitation, recommendation, or financial advice of the Companies operating under the FXOpen brand.

For in-depth analysis, please check ...
 
AUDUSD Technical Analysis – 26 MAY, 2026
AUDUSD – On 26 May 2026, the Australian Dollar against the U.S. Dollar (AUDUSD) registered a significant high at 0.7176

CFLMkmwO_o.png


Technical Analysis: AUDUSD – High 0.7176 (26 May 2026)

On 26 May 2026, the Australian Dollar against the U.S. Dollar (AUDUSD) registered a significant high at 0.7176, marking a pivotal resistance level in the pair’s medium-term trajectory. This level is technically important because it represents a continuation of the bullish momentum that has been building since the prior week’s rebound from the 0.7116 low. The move toward 0.7176 underscores the importance of this threshold in determining whether AUDUSD can sustain its rally or enter a corrective phase.

Price action leading into this high was characterized by a steady climb from the 0.7120 support zone, which had held firm during the prior session. The rally was supported by a sequence of higher intraday lows, reflecting the presence of buyers and reinforcing the bullish bias. However, the rejection at 0.7176 indicates that sellers remain active at higher levels, preventing a decisive breakout. This high now serves as immediate resistance. A sustained close above 0.7176 would open the path toward 0.7220, while failure to breach this level could trigger a corrective pullback toward 0.7120.

Technical indicators provide further insight into the pair’s dynamics. The 50-day moving average, currently positioned near 0.7150, is trending upward, reflecting short-term strength. The 200-day moving average, hovering around 0.7300, remains above current price action, underscoring the longer-term consolidative trajectory. Momentum readings, particularly the Relative Strength Index (RSI), have climbed toward 63, indicating strong bullish momentum but approaching overbought conditions. This suggests that while further upside is possible, caution is warranted as the pair nears resistance.

From a fundamental perspective, the Australian Dollar has been supported by firm commodity prices, particularly iron ore and coal, which remain central to Australia’s export profile. Improved demand from China has provided a tailwind for AUD, reinforcing its strength. The U.S. Dollar, meanwhile, has softened slightly as markets reassess the Federal Reserve’s policy stance. While Treasury yields remain elevated, expectations of a slower pace of tightening have reduced USD demand. Additionally, global risk sentiment has improved, favouring the Australian Dollar as investors rotate into growth-sensitive assets. This dynamic explains why AUDUSD has been able to push toward the 0.7176 resistance despite the Dollar’s underlying strength.

Looking forward, the market outlook for AUDUSD hinges on whether buyers can overcome the 0.7176 resistance. A daily close above this level would likely accelerate bullish momentum, targeting 0.7220 and potentially 0.7250 in extension. Conversely, failure to break higher could invite renewed selling, with immediate support at 0.7120 and deeper support at 0.7116. Traders should closely monitor Australian export data, commodity price trends, and U.S. monetary policy signals, as these will heavily influence the pair’s trajectory.

In summary, the 0.7176 high represents a pivotal resistance zone for AUDUSD. While the short-term trend shows strength, the longer-term outlook depends on whether the Australian Dollar can sustain momentum against the U.S. Dollar. Unless U.S. yields rise sharply or commodity demand weakens, the pair may continue to favor the upside, with the potential for further gains if resistance at 0.7176 is decisively breached.

#fxopen #forex #forexanalysis

Disclaimer: This analysis represents my own opinion only. It is not to be construed as an opinion, offer, solicitation, recommendation, or financial advice of the Companies operating under the FXOpen brand.

For in-depth analysis, please check ...
 
EURCHF Technical Analysis – 26 MAY, 2026
EURCHF – On 26 May 2026, the Euro against the Swiss Franc (EURCHF) registered a significant high at 0.9140

dRfkhkzU_o.png


Technical Analysis: EURCHF – High 0.9140 (26 May 2026)

On 26 May 2026, the Euro against the Swiss Franc (EURCHF) registered a significant high at 0.9140, marking a pivotal resistance level in the pair’s medium-term trajectory. This level is technically important because it represents a continuation of the bullish momentum that has been building since the prior week’s rebound from the 0.9090 low. The move toward 0.9140 underscores the importance of this threshold in determining whether EURCHF can sustain its rally or enter a corrective phase.

Price action leading into this high was characterized by a steady climb from the 0.9100 support zone, which had held firm during the prior session. The rally was supported by a sequence of higher intraday lows, reflecting the presence of buyers and reinforcing the bullish bias. However, the rejection at 0.9140 indicates that sellers remain active at higher levels, preventing a decisive breakout. This high now serves as immediate resistance. A sustained close above 0.9140 would open the path toward 0.9180, while failure to breach this level could trigger a corrective pullback toward 0.9100.

Technical indicators provide further insight into the pair’s dynamics. The 50-day moving average, currently positioned near 0.9120, is trending upward, reflecting short-term strength. The 200-day moving average, hovering around 0.9200, remains above current price action, underscoring the longer-term consolidative trajectory. Momentum readings, particularly the Relative Strength Index (RSI), have climbed toward 62, indicating strong bullish momentum but approaching overbought conditions. This suggests that while further upside is possible, caution is warranted as the pair nears resistance.

From a fundamental perspective, the Euro has been supported by modest improvements in Eurozone economic data, including stronger-than-expected industrial output and resilient consumer sentiment. The Swiss Franc, meanwhile, has been pressured by reduced safe-haven demand as global equity markets stabilized in late May. Although the Swiss National Bank continues to maintain a cautious stance on monetary policy, the Franc’s defensive appeal has diminished in the short term. Interest rate differentials remain narrow, which explains the relatively contained volatility in EURCHF compared to more dynamic currency pairs.

Looking forward, the market outlook for EURCHF hinges on whether buyers can overcome the 0.9140 resistance. A daily close above this level would likely accelerate bullish momentum, targeting 0.9180 and potentially 0.9220 in extension. Conversely, failure to break higher could invite renewed selling, with immediate support at 0.9100 and deeper support at 0.9090. Traders should closely monitor Eurozone inflation data, Swiss National Bank commentary, and global risk sentiment, as these will heavily influence the pair’s trajectory.

In summary, the 0.9140 high represents a pivotal resistance zone for EURCHF. While the short-term trend shows strength, the longer-term outlook depends on whether the Euro can sustain momentum against the Franc. Unless global risk sentiment shifts sharply in favour of CHF or Eurozone fundamentals weaken, the pair may continue to favour the upside, with the potential for further gains if resistance at 0.9140 is decisively breached.

#fxopen #forex #forexanalysis

Disclaimer: This analysis represents my own opinion only. It is not to be construed as an opinion, offer, solicitation, recommendation, or financial advice of the Companies operating under the FXOpen brand.

For in-depth analysis, please check ...
 
EURJPY Technical Analysis – 26 MAY, 2026
EURJPY – On 26 May 2026, the Euro against the Japanese Yen (EURJPY) registered a significant high at 185.35

yol93L3e_o.png


Technical Analysis: EURJPY – High 185.35 (26 May 2026)

On 26 May 2026, the Euro against the Japanese Yen (EURJPY) registered a significant high at 185.35, marking a pivotal resistance level in the pair’s medium-term trajectory. This level is technically important because it represents a continuation of the bullish momentum that has been building since the prior week’s rebound from the 184.40 low. The move toward 185.35 underscores the importance of this threshold in determining whether EURJPY can sustain its rally or enter a corrective phase.

Price action leading into this high was characterized by a steady climb from the 184.50 support zone, which had held firm during the prior session. The rally was supported by a sequence of higher intraday lows, reflecting the presence of buyers and reinforcing the bullish bias. However, the rejection at 185.35 indicates that sellers remain active at higher levels, preventing a decisive breakout. This high now serves as immediate resistance. A sustained close above 185.35 would open the path toward 186.50, while failure to breach this level could trigger a corrective pullback toward 184.50.

Technical indicators provide further insight into the pair’s dynamics. The 50-day moving average, currently positioned near 185.00, is trending upward, reflecting short-term strength. The 200-day moving average, hovering around 180.00, remains well below current price action, underscoring the longer-term bullish trajectory. Momentum readings, particularly the Relative Strength Index (RSI), have climbed toward 65, indicating strong bullish momentum but approaching overbought conditions. This suggests that while further upside is possible, caution is warranted as the pair nears resistance.

From a fundamental perspective, the Euro has been supported by modest improvements in Eurozone economic data, including stronger-than-expected industrial output and resilient consumer sentiment. The Japanese Yen, meanwhile, has been pressured by the Bank of Japan’s continued accommodative stance, which has kept yields low and reduced its appeal relative to the Euro. Although the Yen retains its safe-haven status, global risk sentiment has been sufficiently stable to limit demand for defensive assets, further disadvantaging JPY. Interest rate differentials remain firmly in favour of the Euro, reinforcing its strength against JPY.

Looking forward, the market outlook for EURJPY hinges on whether buyers can overcome the 185.35 resistance. A daily close above this level would likely accelerate bullish momentum, targeting 186.50 and potentially 188.00 in extension. Conversely, failure to break higher could invite renewed selling, with immediate support at 184.50 and deeper support at 183.50. Traders should closely monitor Eurozone inflation data, Bank of Japan commentary, and global risk sentiment, as these will heavily influence the pair’s trajectory.

In summary, the 185.35 high represents a pivotal resistance zone for EURJPY. While the short-term trend shows strength, the longer-term outlook depends on whether the Euro can sustain momentum against the Yen. Unless global risk sentiment shifts sharply in favour of JPY or Eurozone fundamentals weaken, the pair may continue to favour the upside, with the potential for further gains if resistance at 185.35 is decisively breached.

#fxopen #forex #forexanalysis

Disclaimer: This analysis represents my own opinion only. It is not to be construed as an opinion, offer, solicitation, recommendation, or financial advice of the Companies operating under the FXOpen brand.

For in-depth analysis, please check ...
 
EURUSD Technical Analysis – 26 MAY, 2026
EURUSD – On 26 May 2026, the Euro against the U.S. Dollar (EURUSD) registered a significant low at 1.1616

ZOkEUUnJ_o.png


Technical Analysis: EURUSD – Low 1.1616 (26 May 2026)

On 26 May 2026, the Euro against the U.S. Dollar (EURUSD) registered a significant low at 1.1616, marking a pivotal support level in the pair’s medium-term trajectory. This level is technically important because it represents a continuation of the corrective phase that has been unfolding since the prior session’s rejection near 1.1660. The move toward 1.1616 underscores the importance of this threshold in determining whether EURUSD can stabilize or extend its decline.

Price action leading into this low was characterized by a gradual retreat from the 1.1660 resistance zone, which had capped gains earlier in the week. Sellers regained control, driving the pair lower in a sequence of lower highs and lower lows. The decline toward 1.1616 illustrates the vulnerability of the Euro in the current environment. This low now serves as immediate support. A sustained break beneath 1.1616 would expose the next downside target at 1.1580, while a rebound from this level could initiate a corrective rally back toward 1.1660.

Technical indicators confirm the bearish bias. The 50-day moving average, currently positioned near 1.1625, is trending upward but now intersecting with price action, suggesting a potential battle between buyers and sellers. The 200-day moving average, hovering around 1.1480, remains below current price action, underscoring the longer-term bullish trajectory. Momentum readings, particularly the Relative Strength Index (RSI), have dipped toward 45, indicating bearish pressure but not yet oversold conditions. This suggests that further downside remains possible before buyers regain control.

From a fundamental perspective, the Euro has been pressured by uneven growth across the Eurozone, with industrial output and consumer confidence showing signs of strain. Inflationary pressures remain mixed, complicating the European Central Bank’s policy stance. The U.S. Dollar, meanwhile, continues to benefit from elevated Treasury yields and expectations of a hawkish Federal Reserve stance. Interest rate differentials remain firmly in favor of the USD, reinforcing its strength against EUR. Additionally, global risk sentiment has been fragile, with equity market volatility limiting appetite for growth-sensitive currencies like the Euro. This dynamic explains why EURUSD remains capped below the 1.1660 resistance despite occasional rebounds.

Looking ahead, the market outlook for EURUSD depends on whether buyers can defend the 1.1616 low. A daily close below this level would likely accelerate bearish momentum, targeting 1.1580 and potentially 1.1550 in extension. Conversely, if buyers manage to reclaim ground above 1.1660, the pair could attempt a corrective rally toward 1.1720, though strong resistance is expected at that level. Traders should closely monitor Eurozone inflation data, ECB commentary, and U.S. monetary policy signals, as these will heavily influence the pair’s trajectory.

In summary, the 1.1616 low represents a pivotal support zone for EURUSD. While the longer-term trend remains bullish, the short-term outlook is tilted to the downside. Unless Eurozone fundamentals improve or risk appetite strengthens, the Dollar’s strength may continue to dominate, keeping EURUSD under pressure and reinforcing the corrective phase.

#fxopen #forex #forexanalysis

Disclaimer: This analysis represents my own opinion only. It is not to be construed as an opinion, offer, solicitation, recommendation, or financial advice of the Companies operating under the FXOpen brand.

For in-depth analysis, please check ...
 
GBPJPY Technical Analysis – 26 MAY, 2026
GBPJPY – On 26 May 2026, the British Pound against the Japanese Yen (GBPJPY) registered a significant high at 214.67

RiTKNatl_o.png


Technical Analysis: GBPJPY – High 214.67 (26 May 2026)

On 26 May 2026, the British Pound against the Japanese Yen (GBPJPY) registered a significant high at 214.67, marking a pivotal resistance level in the pair’s medium-term trajectory. This level is technically important because it represents a continuation of the bullish momentum that has been building since mid-May, when the pair rebounded from the 212.00 support zone. The move toward 214.67 underscores the importance of this threshold in determining whether GBPJPY can sustain its rally or enter a corrective phase.

Price action leading into this high was characterized by a steady climb from the 213.00 support zone, which had held firm during the prior session. The rally was supported by a sequence of higher intraday lows, reflecting the presence of buyers and reinforcing the bullish bias. However, the rejection at 214.67 indicates that sellers remain active at higher levels, preventing a decisive breakout. This high now serves as immediate resistance. A sustained close above 214.67 would open the path toward 216.00, while failure to breach this level could trigger a corrective pullback toward 213.00.

Technical indicators provide further insight into the pair’s dynamics. The 50-day moving average, currently positioned near 213.50, is trending upward, reflecting short-term strength. The 200-day moving average, hovering around 208.50, remains well below current price action, underscoring the longer-term bullish trajectory. Momentum readings, particularly the Relative Strength Index (RSI), have climbed toward 67, indicating strong bullish momentum but approaching overbought conditions. This suggests that while further upside is possible, caution is warranted as the pair nears resistance.

From a fundamental perspective, the British Pound has been supported by expectations of continued monetary tightening from the Bank of England, as inflationary pressures remain elevated in the UK economy. The Japanese Yen, meanwhile, has been pressured by the Bank of Japan’s accommodative stance, which has kept yields low and reduced its appeal relative to the Pound. Although the Yen retains its safe-haven status, global risk sentiment has been sufficiently stable to limit demand for defensive assets, further disadvantaging JPY. Interest rate differentials remain firmly in favour of GBP, reinforcing its strength against JPY.

Looking forward, the market outlook for GBPJPY hinges on whether buyers can overcome the 214.67 resistance. A daily close above this level would likely accelerate bullish momentum, targeting 216.00 and potentially 218.50 in extension. Conversely, failure to break higher could invite renewed selling, with immediate support at 213.00 and deeper support at 211.50. Traders should closely monitor UK inflation data, Bank of England commentary, and Bank of Japan policy signals, as these will heavily influence the pair’s trajectory.

In summary, the 214.67 high represents a pivotal resistance zone for GBPJPY. While the short-term trend shows strength, the longer-term outlook depends on whether the Pound can sustain momentum against the Yen. Unless global risk sentiment shifts sharply in favour of JPY or UK fundamentals weaken, the pair may continue to favour the upside, with the potential for further gains if resistance at 214.67 is decisively breached.

#fxopen #forex #forexanalysis

Disclaimer: This analysis represents my own opinion only. It is not to be construed as an opinion, offer, solicitation, recommendation, or financial advice of the Companies operating under the FXOpen brand.

For in-depth analysis, please check ...
 
GBPUSD Technical Analysis – 26 MAY, 2026
GBPUSD – On 26 May 2026, the British Pound against the U.S. Dollar (GBPUSD) registered a significant low at 1.3434

ZmwfuC0c_o.png


Technical Analysis: GBPUSD – Low 1.3434 (26 May 2026)

On 26 May 2026, the British Pound against the U.S. Dollar (GBPUSD) registered a significant low at 1.3434, marking a pivotal support level in the pair’s medium-term trajectory. This level is technically important because it represents a continuation of the corrective phase that has been unfolding since the prior session’s rejection near 1.3462. The move toward 1.3434 underscores the importance of this threshold in determining whether GBPUSD can stabilize or extend its decline.

Price action leading into this low was characterized by a gradual retreat from the 1.3460 resistance zone, which had capped gains earlier in the week. Sellers regained control, driving the pair lower in a sequence of lower highs and lower lows. The decline toward 1.3434 illustrates the vulnerability of the Pound in the current environment. This low now serves as immediate support. A sustained break beneath 1.3434 would expose the next downside target at 1.3400, while a rebound from this level could initiate a corrective rally back toward 1.3460.

Technical indicators confirm the bearish bias. The 50-day moving average, currently positioned near 1.3445, is flattening, reflecting short-term weakness. The 200-day moving average, hovering around 1.3600, remains above current price action, underscoring the longer-term consolidative trajectory. Momentum readings, particularly the Relative Strength Index (RSI), have dipped toward 44, indicating bearish pressure but not yet oversold conditions. This suggests that further downside remains possible before buyers regain control.

From a fundamental perspective, the British Pound has been pressured by persistent inflationary concerns and uncertainty surrounding the Bank of England’s policy trajectory. While the central bank remains cautious, markets have begun to question the sustainability of aggressive tightening in the face of slowing growth. The U.S. Dollar, meanwhile, continues to benefit from elevated Treasury yields and expectations of a hawkish Federal Reserve stance. Interest rate differentials remain firmly in favour of the USD, reinforcing its strength against GBP. Additionally, global risk sentiment has been fragile, with equity market volatility limiting appetite for growth-sensitive currencies like the Pound.

Looking ahead, the market outlook for GBPUSD depends on whether buyers can defend the 1.3434 low. A daily close below this level would likely accelerate bearish momentum, targeting 1.3400 and potentially 1.3380 in extension. Conversely, if buyers manage to reclaim ground above 1.3460, the pair could attempt a corrective rally toward 1.3520, though strong resistance is expected at that level. Traders should closely monitor UK inflation data, Bank of England commentary, and U.S. monetary policy signals, as these will heavily influence the pair’s trajectory.

In summary, the 1.3434 low represents a pivotal support zone for GBPUSD. While the longer-term trend remains consolidative, the short-term outlook is tilted to the downside. Unless UK fundamentals improve or risk appetite strengthens, the Dollar’s strength may continue to dominate, keeping GBPUSD under pressure and reinforcing the corrective phase.

#fxopen #forex #forexanalysis

Disclaimer: This analysis represents my own opinion only. It is not to be construed as an opinion, offer, solicitation, recommendation, or financial advice of the Companies operating under the FXOpen brand.

For in-depth analysis, please check ...
 
NZDUSD Technical Analysis – 26 MAY, 2026
NZDUSD – On 26 May 2026, the New Zealand Dollar against the U.S. Dollar (NZDUSD) registered a significant low at 0.5831

lwywMzEh_o.png


Technical Analysis: NZDUSD – Low 0.5831 (26 May 2026)

On 26 May 2026, the New Zealand Dollar against the U.S. Dollar (NZDUSD) registered a significant low at 0.5831, marking a pivotal support level in the pair’s medium-term trajectory. This level is technically important because it represents a continuation of the corrective phase that has been unfolding since the prior session’s rejection near 0.5880. The move toward 0.5831 underscores the importance of this threshold in determining whether NZDUSD can stabilize or extend its decline.

Price action leading into this low was characterized by a gradual retreat from the 0.5880 resistance zone, which had capped gains earlier in the week. Sellers regained control, driving the pair lower in a sequence of lower highs and lower lows. The decline toward 0.5831 illustrates the vulnerability of the New Zealand Dollar in the current environment. This low now serves as immediate support. A sustained break beneath 0.5831 would expose the next downside target at 0.5800, while a rebound from this level could initiate a corrective rally back toward 0.5880.

Technical indicators confirm the bearish bias. The 50-day moving average, currently positioned near 0.5900, has begun to flatten, reflecting short-term weakness. The 200-day moving average, hovering around 0.6100, remains above current price action, suggesting that the longer-term trend is still consolidative rather than decisively bearish. Momentum readings, particularly the Relative Strength Index (RSI), have dipped toward 41, indicating bearish pressure but not yet oversold conditions. This suggests that further downside remains possible before buyers regain control.

From a fundamental perspective, the New Zealand Dollar has been pressured by subdued commodity demand, particularly dairy exports, which remain central to New Zealand’s trade balance. Global growth concerns and weaker demand from China have further weighed on NZD sentiment. The U.S. Dollar, meanwhile, continues to benefit from elevated Treasury yields and expectations of a hawkish Federal Reserve stance. Interest rate differentials remain firmly in favour of the USD, reinforcing its strength against NZD. Additionally, global risk sentiment has been fragile, with equity market volatility limiting appetite for risk-sensitive currencies like the New Zealand Dollar.

Looking ahead, the market outlook for NZDUSD depends on whether buyers can defend the 0.5831 low. A daily close below this level would likely accelerate bearish momentum, targeting 0.5800 and potentially 0.5750 in extension. Conversely, if buyers manage to reclaim ground above 0.5880, the pair could attempt a corrective rally toward 0.5950, though strong resistance is expected at that level. Traders should closely monitor New Zealand’s export data, commodity price trends, and U.S. monetary policy signals, as these will heavily influence the pair’s trajectory.

In summary, the 0.5831 low represents a pivotal support zone for NZDUSD. While the longer-term trend remains consolidative, the short-term outlook is tilted to the downside. Unless New Zealand’s fundamentals improve or risk appetite strengthens, the Dollar’s strength may continue to dominate, keeping NZDUSD under pressure and reinforcing the corrective phase.

#fxopen #forex #forexanalysis

Disclaimer: This analysis represents my own opinion only. It is not to be construed as an opinion, offer, solicitation, recommendation, or financial advice of the Companies operating under the FXOpen brand.

For in-depth analysis, please check ...
 
USDCAD Technical Analysis – 26 MAY, 2026
USDCAD – On 26 May 2026, the U.S. Dollar against the Canadian Dollar (USDCAD) registered a significant high at 1.3821

rUcU568z_o.png


Technical Analysis: USDCAD – High 1.3821 (26 May 2026)

On 26 May 2026, the U.S. Dollar against the Canadian Dollar (USDCAD) registered a significant high at 1.3821, marking a pivotal resistance level in the pair’s medium-term trajectory. This level is technically important because it represents a continuation of the bullish momentum that has been building since early May, when the pair rebounded from the 1.3680 support zone. The move toward 1.3821 underscores the importance of this threshold in determining whether USDCAD can sustain its rally or enter a corrective phase.

Price action leading into this high was characterized by a steady climb supported by a sequence of higher lows, reflecting the presence of buyers and reinforcing the bullish bias. The rejection at 1.3821, however, indicates that sellers remain active at higher levels, preventing a decisive breakout. This high now serves as immediate resistance. A sustained close above 1.3821 would open the path toward 1.3860, while failure to breach this level could trigger a corrective pullback toward 1.3740.

Technical indicators provide further insight into the pair’s dynamics. The 50-day moving average, currently positioned near 1.3700, is trending upward, reflecting short-term strength. The 200-day moving average, hovering around 1.3520, remains well below current price action, underscoring the longer-term bullish trajectory. Momentum readings, particularly the Relative Strength Index (RSI), have climbed toward 67, indicating strong bullish momentum but approaching overbought conditions. This suggests that while further upside is possible, caution is warranted as the pair nears resistance.

From a fundamental perspective, the U.S. Dollar has been supported by elevated Treasury yields and expectations of a hawkish Federal Reserve stance. Interest rate differentials remain firmly in favour of the USD, reinforcing its strength against CAD. The Canadian Dollar, meanwhile, has been pressured by softer crude oil prices, which are central to Canada’s export profile and fiscal health. Weakness in energy markets has translated into reduced demand for CAD, while domestic economic indicators have shown signs of strain. Additionally, global risk sentiment has been fragile, further disadvantaging the Canadian Dollar relative to the U.S. Dollar.

Looking forward, the market outlook for USDCAD hinges on whether buyers can overcome the 1.3821 resistance. A daily close above this level would likely accelerate bullish momentum, targeting 1.3860 and potentially 1.3900 in extension. Conversely, failure to break higher could invite renewed selling, with immediate support at 1.3740 and deeper support at 1.3680. Traders should closely monitor U.S. monetary policy signals and crude oil price movements, as these will heavily influence the pair’s trajectory.

In summary, the 1.3821 high represents a pivotal resistance zone for USDCAD. While the short-term trend shows strength, the longer-term outlook depends on whether the Dollar can sustain momentum against the Canadian Dollar. Unless oil prices rebound or U.S. yields soften, the pair may continue to favour the upside, with the potential for further gains if resistance at 1.3821 is decisively breached.
 
USDCHF Technical Analysis – 26 MAY, 2026
USDCHF – On 26 May 2026, the U.S. Dollar against the Swiss Franc (USDCHF) registered a significant low at 0.7864

ktbU72GL_o.png


Technical Analysis: USDCHF – Low 0.7864 (26 May 2026)

On 26 May 2026, the U.S. Dollar against the Swiss Franc (USDCHF) registered a significant low at 0.7864, marking a pivotal support level in the pair’s medium-term trajectory. This level is technically important because it represents a continuation of the corrective phase that has been unfolding since the prior session’s rejection near 0.7905. The move toward 0.7864 underscores the importance of this threshold in determining whether USDCHF can stabilize or extend its decline.

Price action leading into this low was characterized by a gradual retreat from the 0.7900 resistance zone, which had capped gains earlier in the week. Sellers regained control, driving the pair lower in a sequence of lower highs and lower lows. The decline toward 0.7864 illustrates the vulnerability of the Dollar in the current environment. This low now serves as immediate support. A sustained break beneath 0.7864 would expose the next downside target at 0.7830, while a rebound from this level could initiate a corrective rally back toward 0.7900.

Technical indicators confirm the bearish bias. The 50-day moving average, currently positioned near 0.7880, is flattening, reflecting short-term weakness. The 200-day moving average, hovering around 0.7700, remains below current price action, underscoring the longer-term bullish trajectory. Momentum readings, particularly the Relative Strength Index (RSI), have dipped toward 44, indicating bearish pressure but not yet oversold conditions. This suggests that further downside remains possible before buyers regain control.

From a fundamental perspective, the U.S. Dollar has softened slightly as markets reassess the Federal Reserve’s policy stance. While Treasury yields remain elevated, expectations of a slower pace of tightening have reduced USD demand. The Swiss Franc, meanwhile, has benefited from safe-haven demand as global equity markets experienced volatility in late May. Although the Swiss National Bank continues to maintain a cautious stance on monetary policy, the Franc’s defensive appeal has outweighed yield considerations in the short term. This dynamic explains why USDCHF remains capped below the 0.7900 resistance despite occasional rebounds.

Looking ahead, the market outlook for USDCHF depends on whether buyers can defend the 0.7864 low. A daily close below this level would likely accelerate bearish momentum, targeting 0.7830 and potentially 0.7800 in extension. Conversely, if buyers manage to reclaim ground above 0.7900, the pair could attempt a corrective rally toward 0.7950, though strong resistance is expected at that level. Traders should closely monitor U.S. monetary policy signals, Swiss National Bank commentary, and global risk sentiment, as these will heavily influence the pair’s trajectory.

In summary, the 0.7864 low represents a pivotal support zone for USDCHF. While the longer-term trend remains bullish, the short-term outlook is tilted to the downside. Unless global risk sentiment shifts sharply in favour of the Dollar or U.S. yields rise further, the Franc’s safe-haven appeal may continue to dominate, keeping USDCHF under pressure and reinforcing the corrective phase.

#fxopen #forex #forexanalysis

Disclaimer: This analysis represents my own opinion only. It is not to be construed as an opinion, offer, solicitation, recommendation, or financial advice of the Companies operating under the FXOpen brand.

For in-depth analysis, please check ...
 
USDJPY Technical Analysis – 26 MAY, 2026
USDJPY - On 26 May 2026, the U.S. Dollar against the Japanese Yen (USDJPY) registered a significant high at 159.37,

may5ajs4_o.png


Technical Analysis: USDJPY – High 159.37 (26 May 2026)

On 26 May 2026, the U.S. Dollar against the Japanese Yen (USDJPY) registered a significant high at 159.37, marking one of the strongest points for the pair in recent months. This level is technically important because it represents a continuation of the bullish momentum that has been building since March, driven by sustained U.S. Dollar strength and relative weakness in the Yen. The move toward 159.37 underscores the importance of this threshold in determining whether USDJPY can sustain its rally or enter a corrective phase.

Price action leading into this high was characterized by a steady climb from the 157.50 support zone, which had held firm through mid-May. The rally was supported by a sequence of higher lows, confirming the presence of buyers and reinforcing the bullish bias. However, the rejection at 159.37 indicates that sellers remain active at higher levels, preventing a decisive breakout. This high now serves as immediate resistance. A sustained close above 159.37 would open the path toward 160.50, while failure to breach this level could trigger a corrective pullback toward 157.50.

Technical indicators reinforce the bullish outlook. The 50-day moving average, currently positioned near 157.80, is trending upward, reflecting short-term strength. The 200-day moving average, hovering around 150.00, remains well below current price action, underscoring the longer-term bullish trajectory. Momentum readings, particularly the Relative Strength Index (RSI), have climbed toward 69, suggesting strong bullish momentum but approaching overbought territory. This implies that while further upside is possible, caution is warranted as the pair nears resistance.

From a fundamental perspective, the U.S. Dollar has been supported by elevated Treasury yields and expectations of a hawkish Federal Reserve stance. Interest rate differentials remain firmly in favour of the USD, reinforcing its strength against JPY. The Japanese Yen, meanwhile, has been pressured by the Bank of Japan’s continued accommodative stance, which has kept yields low and reduced its appeal relative to the Dollar. Although the Yen retains its safe-haven status, global risk sentiment has been sufficiently stable to limit demand for defensive assets, further disadvantaging JPY.

Looking ahead, the market outlook for USDJPY hinges on whether buyers can overcome the 159.37 resistance. A daily close above this level would likely accelerate bullish momentum, targeting 160.50 and potentially 162.00 in extension. Conversely, failure to break higher could invite renewed selling, with immediate support at 157.50 and deeper support at 156.00. Traders should closely monitor U.S. monetary policy signals and Bank of Japan commentary, as these will heavily influence the pair’s trajectory.

In summary, the 159.37 high represents a pivotal resistance zone for USDJPY. While the short-term trend shows strength, the longer-term outlook depends on whether the Dollar can sustain momentum against the Yen. Unless global risk sentiment shifts sharply in favour of JPY or U.S. yields soften, the pair may continue to favour the upside, with the potential for further gains if resistance at 159.37 is decisively breached.

#fxopen #forex #forexanalysis

Disclaimer: This analysis represents my own opinion only. It is not to be construed as an opinion, offer, solicitation, recommendation, or financial advice of the Companies operating under the FXOpen brand.

For in-depth analysis, please check ...
 
Back
Top Bottom