Daily Market Analysis By FXOpen

BTCUSD and XRPUSD Technical Analysis – 14th DEC, 2021
dc.jpg


BTCUSD: Head and Shoulders Pattern Below $50,000

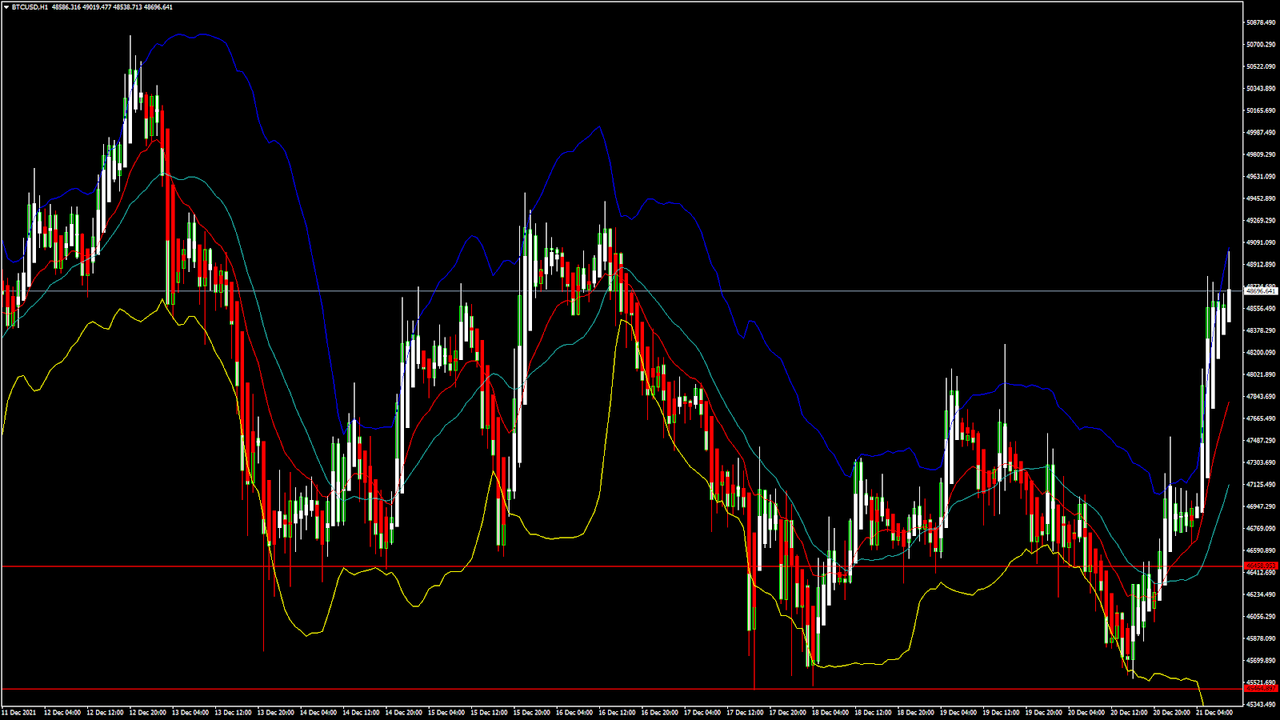
Bitcoin was unable to sustain its bullish momentum on 12th Dec and declined after having touched a high of $50,701. We can observe a continuous fall since it touched its all-time high of $59,119 on 30th Nov.

This fall in BTCUSD can also be attributed to the broad-based December selling in crypto markets; this is a time when global investors seem to withdraw their profits and investments due to the upcoming Christmas and New Year holiday season.

In today's European trading session, bitcoin is again back in the bearish channel, trading below the $50,000 handle.

We can clearly see a head-and-shoulders pattern below the $50,000 handle which signifies a fall in the price of Bitcoin and a continuation of the bearish downtrend.

At present, the price of bitcoin has entered a consolidation phase below the $48,000, and this is expected to continue in the US trading session.

Both the Stoch and StochRSI are indicating an OVERBOUGHT level, which means that in the immediate short-term, a decline in the price is expected.

Bitcoin is moving below its both 100 hourly simple and exponential moving averages.

The average true range is indicating a lesser market volatility, which means that markets will be entering a consolidation phase soon.

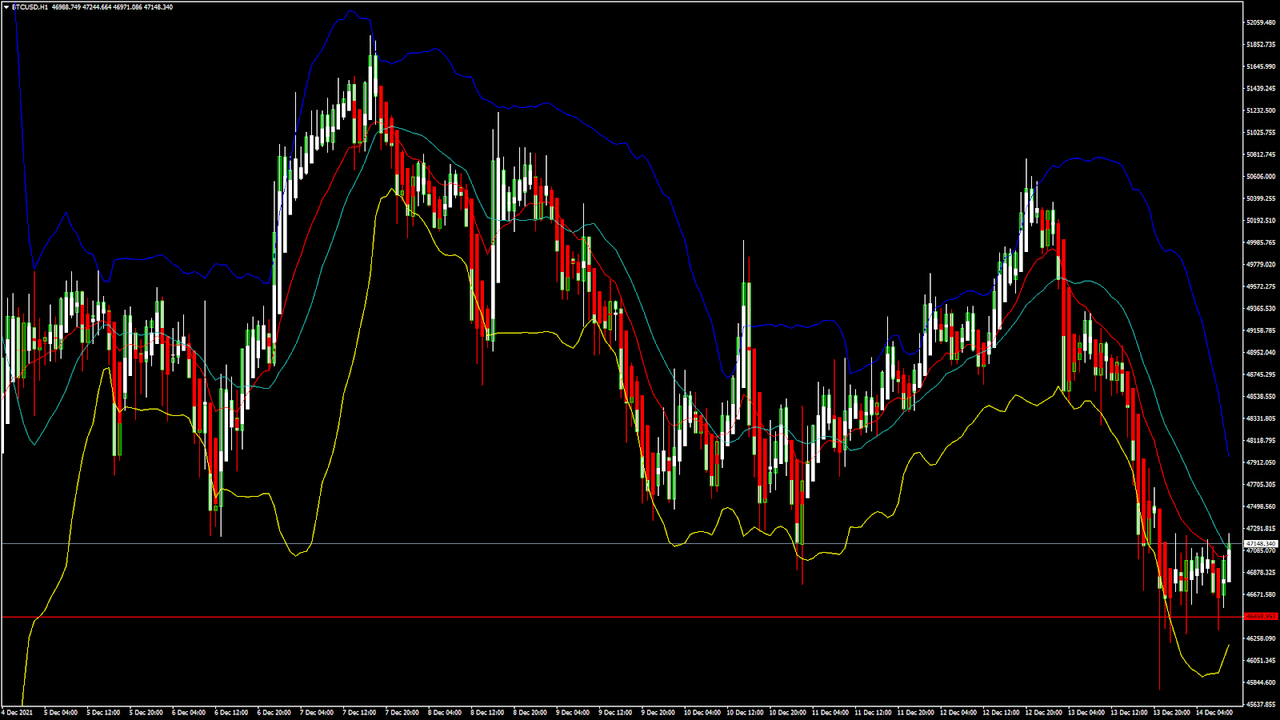
  • Bitcoin trend reversal is seen below $50,000
  • Stoch is indicating an OVERBOUGHT level
  • The price is now trading just above its pivot level of $46,895
  • All the moving averages are giving a SELL signal at current market level of $47,146

Bitcoin: Bearish Momentum Below $50,000 Confirmed
chrt.png


BTCUSD is struggling to keep itself above the $50,000 mark, and we can see a mild bullish channel which suggests that a further decline can be expected.

Some of the major technical indicators are giving a SELL signal, which means that the price will fall below $45,000 soon.

In the European trading session, the price of BTCUSD is trading above its classic support level of $46,708 and Fibonacci support level of $46,594.

In the last 24hrs, BTCUSD has gone DOWN by 3.74% with a price change of $1,830, and has a 24hr trading volume of USD 33.547 billion. Compared to yesterday, there was a 41.25% increase in the trading volume. This increase happened thanks to the increased selling pressure, as well as liquidation of bitcoin holdings by investors.

The Week Ahead

Bitcoin continues tumbling down from its Nov 30th all-time high of $59,119. A further decline will push it below the $45,000 handle.

The medium to long-term outlook remains BULLISH for bitcoin, with a target of $55,000. At present, the markets are giving a SELL signal, so it would be best to enter into short positions.

The relative strength index of 42 is indicating a bearish channel, and fresh selling is expected in the markets at any time. This is also due to the renewed fears related to the Omicron coronavirus variant, and many countries shutting down their international borders.

Technical Indicators:

Stoch (9,6): at 98.95 indicating an OVERBOUGHT level

Average directional change (14-day): at 42.60 indicating a SELL

Rate of price change: at -0.837 indicating a SELL

Moving averages convergence divergence (12,26): at -447.70 indicating a SELL

Read Full on FXOpen Company Blog...
 
The low Turkish Lira and the tourism opportunity
lira.jpg


Turkey, a huge nation which is home to over 84 million people, is in an interesting position economically and politically and has been for some time.

The current economic outlook is one of surprising doom, and the focus over the past day by mainstream economists in Western countries has been on the anticipation of a rate cut which has caused the Lira to plunge to a new low, which is quite a significant market event given that it began this month at a very low value.

Yesterday was a particularly interesting session for the Lira, given that it was trading at 14.33 to the dollar at 1:25 p.m. in Istanbul, representing a slight recovery from the record low of 14.99 earlier in the day but still languishing at all time lows.

The mere thought that a commonly-traded currency which is not a major and could be considered to be one of the 'exotics' which is often traded against majors would plunge to a lower value than ever recorded could well prove to be a point of interest among traders and market participants.

Turkey may well be having a fiscal apocalypse in the eyes of its own central bank and policymakers and financial leaders globally, as the nation's own central bank began to intervene directly in the FX market on Monday this week by selling dollars to prop up the lira, but there are two sides to this situation which could lead to some degree of volatility.

Whilst President Recep Tayyip Erdogan has taken a hardline stance against raising interest rates, Turkey's finance minister aligns with the idea as do many global economists which agree would actually aid the currency and go toward stemming the rampant inflation, which is now at approximately 20%.

Thus, the currency is in the doldrums but the wider economy of Turkey has perhaps some degree of potential, as it is one of the only countries within which tourism makes up a vast percentage of the national industry base which is welcoming tourists without many restrictions.

In 2018, Tourism directly accounted for 7.7% of total employment in Turkey, directly employing 2.2 million people and total income from tourism was 3.8% of GDP.

The nation's nominal per capita income - effectively the average salary per person - in Turkey is $9,300 which is considerably short of the national average per capita GDP in Western nations which are home to major currencies, which means that any movement in the all important tourist industry makes all the difference to the outlook within Turkey and therefore could directly affect the value of the Lira

Turkey's government has officially announced just three weeks ago that it will not be implementing any lockdowns going forward, and Turkey remains open to tourists.

Every year, over one million British tourists flock to Turkey's sun-soaked resorts and with those resorts very much open for business, the possibility of restrictions being implemented across the United Kingdom over the winter period and the low value of the Turkish lira meaning that British travelers get more bang for their buck, it could be that the Turkish economy may get a boost from those looking for an escape from further curtailment of freedoms to a warmer climate for a few weeks with a great exchange rate.

Many residents of Germany visit Turkey each year, some for vacation and others to visit their families and FX transactions between Germany and Turkey put the Euro and the Lira against each other very regularly.

Given Germany's current strict Covid rules, Turkey's low value Lira and open society with little restrictions may appeal.

Bearing in mind the internal issues of inflation and a beleaguered economy and the restrictions in Europe which may drive an open-for-business Turkish tourist industry forward, there may be some degree of volatility in the Lira when traded against the Euro or the Pound.

FXOpen Blog
 
EUR/USD and USD/CHF: Dollar Could Gains Momentum
Euro-EUR-USD-1.jpg


EUR/USD is struggling to gain momentum above the 1.1300 zone. USD/CHF is rising, and it might extend gains above the 0.9250 level.

Important Takeaways for EUR/USD and USD/CHF


  • The Euro failed to gain strength and declined below 1.1300 against the US Dollar.
  • There was a break below a key bullish trend line with support near 1.1270 on the hourly chart of EUR/USD.
  • USD/CHF started a decent increase from the 0.9200 support zone.
  • There is a major bearish trend line forming with resistance near 0.9250 on the hourly chart.

EUR/USD Technical Analysis

The Euro attempted an upside break above the 1.1325 resistance zone against the US Dollar. The EUR/USD pair failed to gain strength above 1.1325 and started a fresh decline.

There was a clear break below the 1.1300 and 1.1280 support levels. Besides, there was a break below a key bullish trend line with support near 1.1270 on the hourly chart of EUR/USD. The pair even broke the 1.1260 support and the 50 hourly simple moving average.

EUR/USD Hourly Chart
EURUSD-Chart-2x.jpg


It traded as low as 1.1250 on FXOpen and is consolidating losses. On the upside, an initial resistance is near the 1.1272 level. The 23.6% Fib retracement level of the recent decline from the 1.1326 swing high to 1.1250 low is also near 1.1272.

The next major resistance is near the 1.1285 zone. It is near the 50% Fib retracement level of the recent decline from the 1.1326 swing high to 1.1250 low. A clear upside break above the 1.1300 zone could open the doors for a steady move.

The next major resistance sits near the 1.1325 level. On the downside, an immediate support is near the 1.1250 level. The next major support is near the 1.1220 level.

A downside break below the 1.1220 support could start another decline. The next major support sits near 1.1150.

Read Full on FXOpen Company Blog...
 
GBP/USD Aims Recovery While EUR/GBP Is Sliding
gbp-1.jpg


GBP/USD is attempting a recovery wave above the 1.3220 resistance. EUR/GBP is declining and is gaining pace below the 0.8550 level.

Important Takeaways for GBP/USD and EUR/GBP


  • The British Pound is facing resistance near the 1.3280 and 1.3300 levels.
  • There was a break above a major bearish trend line with resistance near 1.3240 on the hourly chart of GBP/USD.
  • EUR/GBP started a fresh decline from well above the 0.8580 support level.
  • There is a major bearish trend line forming with resistance near 0.8540 on the hourly chart.

GBP/USD Technical Analysis

The British Pound declined heavily below the 1.3300 level against the US Dollar. The GBP/USD pair formed a base above the 1.3265 level and recently started an upside correction.

The pair recovered above the 1.3200 resistance level. There was a break above the 50% Fib retracement level of the downward move from the 1.3289 high to 1.3163 low (formed on FXOpen). Besides, there was a break above a major bearish trend line with resistance near 1.3240 on the hourly chart of GBP/USD.

The pair is now trading near the 1.3250 level and the 50 hourly simple moving average. It is close to the 76.4% Fib retracement level of the downward move from the 1.3289 high to 1.3163 low.

On the upside, an initial resistance is near the 1.3265 level. If there is an upside break above the 1.3450 resistance and the 50 hourly SMA, the price could surpass 1.3280. The main resistance is near the 1.3300 zone.

Therefore, a proper break above the 1.3300 resistance could open the doors for a steady increase. The next major resistance for the bulls could be 1.3350. If not, the pair could start a fresh decline below 1.3220. An immediate support is near the 1.3200 level.

The first key support is near the 1.3180 level. Any more losses could lead the pair towards the 1.3150 support zone. The next major support sits near the 1.3080 level.

Read Full on FXOpen Company Blog...
 
Is the EURUSD heading for parity?
dc.jpg


We have all been here before.

Despite the major currencies not being particularly volatile for many years, the differences between those on each side of the Atlantic is now becoming quite marked and has perhaps been the direction to watch for a considerable period of time.

Today, the EURUSD pair is trading at 1.13, which is the second-lowest point in over one year.

Just a month ago, at the beginning of this strong and continual period of downward movement for the 'cable' pair, analysts in senior positions in Wall Street and the City of London were beginning to consider the possibility that the EURUSD pair's value may make a return to that of 2014 when parity was almost achieved.

Given that many of the more industrially developed nations within the Eurozone have become subject to further restrictions at the hands of their respective governments, confidence has been affected as market participants take into account the potential effect slower production and less effective working practices in Austria, Germany and Holland could have on the wider Eurozone's stability.

In particular, Germany, which has a population of over 80 million and a traditional industry base which requires employees to attend their place of work as opposed to many large scale, high producing businesses in the Anglosphere which are often internet based or intrinsically linked to the big tech giants, therefore meaning working from pretty much anywhere would not stifle output.

Germany's largest employers are heavy manufacturing businesses such as Volkswagen, Bosch and Siemens, all of which require staff to travel to their factories. Restrictions being implemented by the national government would have a direct impact on this.

Whilst the US government is also talking about introducing restrictions, it has not brought in any Covid passport system yet, and has only done so for travel purposes whilst some of the European nations are doing so for access to everyday events and there is concern that this may extend to workplaces.

Looking at the EURUSD pair one month ago, it was trading at a healthy 1.22 which had been the case for quite a number of months, however as the year draws to a close we are looking at a clear downward line.

Just two weeks ago, the euro-Swiss franc pair fell below parity on November 1 for the first time in almost a year, echoing the same sentiment among traders.

At the beginning of this month, options traders were investing in options with longer expiry dates even before the euro dropped below 1.15, showing that a conservative approach is the current default.

Whether we will see parity or not is yet to be determined, however this is a really unusual downturn and has been on this trajectory for long enough to make it a real feature within the FX market.

FXOpen Blog
 
ETHUSD and LTCUSD Technical Analysis – 16th DEC, 2021
cx.jpg


ETHUSD: Double Bottom Pattern Above $3,600

Ethereum started this week on a mild bullish tone by touching a high of $4,169 after which the decline started pushing its prices below the $4,000 handle.

We saw Ethereum touching an intraday low of $3,654 yesterday, after which fresh buying in the market pushed its prices all the way above the $4000 mark. The recovery was also backed by the Three Arrows Capital hedge fund purchasing $56 million worth of Ether.

ETHUSD is slowly preparing itself for its next move against the US dollar.

We can clearly see a double bottom pattern above $3,600, which signifies the end of a downtrend and a shift towards an uptrend.

ETH is now trading just above its pivot level of $3,998 and moving in a bullish ascending channel. The price of ETHUSD is about to break its classic resistance level of $4,048, its Fibonacci resistance level of $4,035, and is now aiming towards the $4,200 handle in the US trading session.

All the major technical indicators are giving a STRONG BUY signal.

ETH is now trading above its 100 hourly and below its 200 hourly simple moving averages.

  • Ethereum trend reversal seen above $3,600
  • Short-term range appears to be bullish for ETHUSD
  • All the moving averages are giving a BUY signal
  • Average true range is indicating LESS market volatility

Ether: Bullish Reversal towards $4,200 Confirmed
eth.png


ETHUSD has recovered from its losses and is now moving in the consolidation phase below the $4,200 handle in the European trading session.

Stoch and average directional change are indicating a NEUTRAL market.

We can see a 34.50% increase in the trading volume as compared to yesterday, because the market was in a consolidation phase, and today, new buyers have entered as the bullish pattern is clearly visible.

ETH has gained +4.58% with a price change of +176.90$ in the past 24hrs and has a trading volume of 26.810 billion USD.

The Week Ahead

Ether is now waiting for its next move against the US dollar. We can see that the price continues to hold above the important psychological support level of $4,000.

The medium to long-term outlook for Ether remains bullish with targets of $4,500 to $5,000 in January 2022.

This is also a time when long-term investors tend to liquidate their holdings and withdraw the profits. Because of the coming end-of-year Christmas and New Year holidays, the liquidity will remain low and the advances limited.

We have detected an MA5 crossover pattern which signifies a bullish trend in the coming days. A bullish crossover pattern is also seen in the MA100.

Technical Indicators:

Ultimate oscillator: at 54.75 indicating a BUY

Moving averages convergence divergence (14-day): at 54.07 indicating a BUY

Commodity channel index (14days): at 34.51 indicating a NEUTRAL market

Rate of price change: at 8.161 indicating a BUY

Read Full on FXOpen Company Blog...
 
AUD/USD and NZD/USD Remains Supported On Dips
AUD-22.jpg


AUD/USD gained pace after there was a clear move above 0.7200. NZD/USD is correcting gains, but dips might be limited below the 0.6750 support.

Important Takeaways for AUD/USD and NZD/USD


  • The Aussie Dollar started a steady rise above the 0.7200 resistance against the US Dollar.
  • There is a key bullish trend line forming with support near 0.7135 on the hourly chart of AUD/USD.
  • NZD/USD rallied towards the 0.6840 level before there was a downside correction.
  • There was a break above a major bearish trend line with resistance near 0.6765 on the hourly chart of NZD/USD.

AUD/USD Technical Analysis

The Aussie Dollar started a major increase after it formed a base above the 0.7100 level against the US Dollar. The AUD/USD pair gained pace for a move above the 0.7200 for sustained upward move.

The pair even broke the 0.7220 resistance zone and the 50 hourly simple moving average. It traded as high as 0.7223 on FXOpen before it started a downside correction. There was a move below the 0.7210 and 0.7200 levels.

AUD/USD Hourly Chart
AUDUSD-Chart.jpg


The pair traded below the 23.6% Fib retracement level of the upward move from the 0.7093 swing low to 0.7223 high. The pair is now testing the 0.7155 level and the 50 hourly simple moving average.

It is finding bids near the 50% Fib retracement level of the upward move from the 0.7093 swing low to 0.7223 high. There is also a key bullish trend line forming with support near 0.7135 on the hourly chart of AUD/USD.

If there is a downside break below the 0.7135 support, the pair could extend its decline towards the 0.7100 level. On the upside, an immediate resistance is near the 0.7180 level.

The next major resistance is near the 0.7200 level. A close above the 0.7200 level could start a steady increase in the near term. The next major resistance could be 0.7250.

Read Full on FXOpen Company Blog...
 
GBP/USD Continues To Struggle, USD/CAD Gains Momentum
GBPUSD-British-Pound.jpg


GBP/USD failed to recover and declined below the 1.3250 support. USD/CAD is rising and is showing positive signs above the 1.2850 support.

Important Takeaways for GBP/USD and USD/CAD


  • The British Pound started a fresh decline from the 1.3375 resistance zone.
  • There was a break below a key bullish trend line with support near 1.3235 on the hourly chart of GBP/USD.
  • USD/CAD started a major increase above the 1.2780 and 1.2800 resistance levels.
  • There is a major bullish trend line forming with support near 1.2810 on the hourly chart.

GBP/USD Technical Analysis

After a major decline, the British Pound found support above 1.3180 against the US Dollar. GBP/USD started a recovery wave above the 1.3300 level, but it failed to continue higher.

A high was formed near 1.3374 on FXOpen and the pair started a fresh decline. There was a break below the 1.3320 and 1.3300 support levels. The pair traded below the 50% Fib retracement level of the upward move from the 1.3173 swing low to 1.3374 high.

GBP/USD Hourly Chart
GBPUSD-Chart-2x.jpg


It is now trading below the 1.3250 level and the 50 hourly simple moving average. There was a break below a key bullish trend line with support near 1.3235 on the hourly chart of GBP/USD.

An immediate resistance is near the 1.3250 level. The first major resistance is near the 1.3300 level. If there is an upside break above the 1.3300 zone, the pair could rise towards 1.3350.

The next key resistance could be 1.3375, above which the pair could gain strength. On the downside, the first key support is near the 1.3220 area. It is near the 76.4% Fib retracement level of the upward move from the 1.3173 swing low to 1.3374 high.

If there is a break below 1.3220, the pair could decline extend its decline. The next key support is near the 1.3200 level. Any more losses might call for a test of the 1.3150 support.

Read Full on FXOpen Company Blog...
 
Will 2022 Be the Year of the Japanese Yen?
jap.jpg


The Japanese yen (JPY) was one of the currencies that depreciated the most this year. Even in the late December trading, the JPY is at its yearly lows, especially against the dollar.

This is somehow surprising, considering the Fed's tapering, but stocks outperformed during the year, justifying the weakness in the JPY pairs.

The yen is viewed as a safe-haven currency that appreciates in times of uncertainty and depreciates when the stock market is bullish. But recently, the JPY pairs' rally has been stalling. For instance, the USD/JPY pair had difficulty finding buyers above 115, while the EUR/JPY found sellers above 133.

Is the change in leadership good for the JPY? The newly appointed Prime Minister Fumio Kishida has big spending plans to stimulate Japanese economic growth, which might be key to how the JPY will perform in 2022.
jpy.jpg


Three Reasons to Buy the JPY in 2022

To start with, the economic recovery in Japan lagged the one in other parts of the world. A late vaccination campaign led to a delay in the economic reopening. Thus, the economy may move near to its full potential going forward.

A brighter economic outlook should bode well for inflation. Forecasts point to inflation moving higher in the period ahead but to remain far from the 2% target. In any case, inflationary problems are not exacerbated in Japan, compared to rival economies, which may further spur economic growth, thus favoring the currency.

Finally, there is a whopping accumulation of 3.7% of GDP in excess savings. Consumers choose to save for various reasons, such as the COVID-19 pandemic uncertainties, but, when injected into the economy, these funds will support further economic expansion.

For many years, the JPY has been perceived as a safe-haven currency, just like the Swiss franc. Is it time for the JPY to start reflecting the strength of the local economy? If that is the case, stronger than expected economic growth should trigger a more dominant JPY in the year ahead.

FXOpen Blog
 
The Pound regains its losses against the Euro; will it continue?
pound.jpg


November has been an interesting time for the Euro, as the Eurozone's economic leaders have been dominating the headline news throughout November and December.

Unlike the economic landscape of the United States or Britain, home to the Euro's major currency pair rivals, the member states within the European Union that are the most economically important to the Eurozone have been subjected to clear and defined sets of restrictions which have in some cases excluded entire demographics from conducting business.

A few days ago, the Euro plunged to a new four-week low, however it had begun to rebuild its position against the Pound, with many traders appearing to show a bearish perspective for the immediate future value of the Pound, largely because of the general consensus that there could be a lockdown implemented in the United Kingdom within the next few days.

This morning, however, the talks which were set to be held by the British government were postponed until after the holiday period, meaning that it is very likely that there will be no lockdown in the United Kingdom, and businesses will be able to operate as usual. Given that this particular period of the year is usually a time during which many people take time out from work and spend on two things; entertainment and shopping.

Traditionally, the British High Street is the place of choice for many people on the day after Christmas Day, when bargains are to be had and millions of Pounds are spent in retail shops.

Had they been forced to close, that would have put a large percentage of British business in a no-revenue situation.

Prior to the shopping comes the reveling. On Christmas Eve, many people head out to town centres to enjoy food and drink, and with the hospitality sector in full swing and no Christmas lockdown looming, the cash will likely flow freely.

Meanwhile in Europe, some experienced analysts and traders are considering the likelihood of an extensive shutdown, which many see as a catalyst which could drive markets down, therefore are looking to hedge their assets and cover themselves.

For that reason, The Euro is now quite volatile against the British Pound, with the GBPEUR pair rising back up to 1.17 from its dip earlier this week, and having gone out of its 4-week low at the end of last week.

Whilst the lockdowns and restrictions in Europe may not have yet traveled across the English Channel, there is still a cautious sentiment among traders of the Pound and FTSE 100 stock in case there is a reintroduction of restrictions before New Year's Day.

Hospitality and airline stocks are definitely ones to watch, but the main interest here will likely be currencies as the difference between the ability to spend the holiday period doing retail therapy and socializing in bars and restaurants may differ between Europe and the United Kingdom, therefore leading to less potential revenues for retail and hospitality businesses and an economy even more bruised compared to one that may be able to recouperate some of its losses.

Either way, volatility in the GBPEUR pair is a rarity, and perhaps one to keep an eye on over the next few days.

FXOpen Blog
 
BTCUSD and XRPUSD Technical Analysis – 21st DEC, 2021
bt.jpg


BTCUSD: Double Bottom Pattern Above $45,000

Bitcoin started the week on a bearish tone by breaking the $46,000 handle, and touching a low of $45,578 in yesterday's US trading session.

After this decline, we saw a renewed buying pressure which continues to push the prices higher in today's European trading session.

The global fall in cryptocurrencies is happening because of the emergence of the Omicron coronavirus variant, as well as the approaching ending of the year whereby the investments in the financial markets is at its lowest.

Bitcoin has gone back in the bullish channel and been trading above the $48,000 handle; we could see more upsides in the range of $49,000 to $49,500 later today.

Now, we can clearly see a double-bottom bullish reversal pattern above the $45,000 handle signifying the end of a downtrend and a shift towards an uptrend.

At present, the bitcoin price is trading in a consolidation phase above the $48,000 handle, which is expected to continue in the US trading session.

Both the Stoch and StochRSI are indicating an OVERBOUGHT level meaning that in the immediate short-term, a decline is expected.

Bitcoin is now moving above its both 100 hourly simple and exponential moving averages.

The average true range is indicating a lesser market volatility, which means that markets will enter a consolidation phase soon.

  • Bitcoin trend reversal is seen above $45,000
  • The Williams percent range is Indicating an OVERBOUGHT level
  • The price is now trading just above its pivot level of $48,572
  • All the moving averages are giving a STRONG BUY signal at the current market level of $48,676

Bitcoin's Bullish Reversal Above $45,000 Confirmed
btc.png


We can now see that the bullish trend for bitcoin remains intact, and the prices are expected to cross the important psychological resistance level of $50,000 very soon.

All of the major technical indicators are giving a STRONG BUY signal, which means that we can expect a fresh rally coming into the markets any time.

The price of BTCUSD is now facing its classic resistance level of $48,691 and Fibonacci resistance level of $48,808, after which the path towards $50,000 will get cleared.

In the last 24hrs, BTCUSD has gone UP by 5.17% with a price change of $2,393, and has a 24hr trading volume of USD 31.610 billion. We can see an Increase of 11.33% in the trading volume as compared to yesterday. This increase happened thanks to the increased buying pressure after the confirmation of the bullish channel.

The Week Ahead

We can see that bitcoin has started its long overdue upside correction, and the price has reached the consolidation level above the $48,000 mark.

The medium to long-term outlook remains BULLISH for bitcoin with targets of $52,000 to $55,000.

The relative strength index is above 70, indicating a stronger demand for buying BTCUSD in the markets.

At present, long-term buyers can enter into markets with a time frame of 6 months to 1 year.

90% of Bitcoins Mined

Over the course of 12 years, 90% of all bitcoins have been mined, explaining the increase in global circulation levels and market liquidity of available coins.

According to the Bitcoin founder Satoshi Nakamoto, the total supply is 21 million; the mining of the remaining 10%, however, will take 120 years due to the halving process.

Crypto in 2021

In 2021, we saw massive inflows in crypto and bitcoin, something that led to the increase in total market capitalization and massive gains for long-term investors who had invested in the beginning of the year.

In total, we saw capital inflow of more than USD 30 billion — this is why 2021 has been nicknamed the Year of Crypto. In comparison, the capital inflow in 2018 was at USD 8 billion, the second best year for crypto investors globally.

Technical Indicators:

Relative strength index (14-day): at 73.68 indicating a BUY

Average directional change (14-day): at 47.40 indicating a BUY

Rate of price change: at 5.542 indicating a BUY

Moving averages convergence divergence (12,26): at 496.50 indicating a BUY

Read Full on FXOpen Company Blog...
 
EUR/USD and USD/CHF: Dollar Bulls In Control
Euro-Pound-Yen.jpg


EUR/USD is still struggling to gain momentum above the 1.1320 zone. USD/CHF is rising, and it might extend gains above the 0.9250 level.

Important Takeaways for EUR/USD and USD/CHF


  • The Euro is trading well below the 1.1320 and 1.1350 resistance levels against the US Dollar.
  • There is a key bearish trend line forming with resistance near 1.1288 on the hourly chart of EUR/USD.
  • USD/CHF started a decent increase from the 0.9190 support zone.
  • There was a break above a major bearish trend line with resistance near 0.9230 on the hourly chart.

EUR/USD Technical Analysis

The Euro attempted an upside break above the 1.1350 resistance zone against the US Dollar. The EUR/USD pair failed to gain strength above 1.1350 and started a fresh decline.

There was a clear break below the 1.1320 and 1.1300 support levels. The pair even broke the 1.1280 support and the 50 hourly simple moving average. It traded as low as 1.1235 on FXOpen and is correcting losses.

EUR/USD Hourly Chart
EURUSD-Chart-3x.jpg


On the upside, an initial resistance is near the 1.1285 level. The 38.2% Fib retracement level of the recent drop from the 1.1360 swing high to 1.1235 low is also near 1.1285.

There is also a key bearish trend line forming with resistance near 1.1288 on the hourly chart of EUR/USD. The next major resistance is near the 1.1300 zone. It is near the 50% Fib retracement level of the recent drop from the 1.1360 swing high to 1.1235 low.

A clear upside break above the 1.1300 zone could open the doors for a steady move. The next major resistance sits near the 1.1350 level. On the downside, an immediate support is near the 1.1255 level. The next major support is near the 1.1235 level.

A downside break below the 1.1235 support could start another decline. The next major support sits near 1.1200.

Read Full on FXOpen Company Blog...
 
ETHUSD and LTCUSD Technical Analysis – 23rd DEC, 2021
px.jpg


ETHUSD: Head and Shoulders Pattern Below $4,000

Ethereum was unable to sustain its bullish momentum and started its decline below the $4,000 handle in the Asian trading session today.

ETHUSD touched an intraday low of $3,894; the selling pressure continues in the European trading session. We can clearly see a head-and-shoulders pattern below the $4,000 handle which signifies that the prices will break out into a bearish downtrend.

ETH is now trading just below its pivot level of $3,926 and is moving in a bearish descending channel. The price of ETHUSD is about to break its classic support level of $3,890 and its Fibonacci support level of $3,903, after which the path towards $3,800 will get cleared.

All the major technical indicators are giving a STRONG SELL signal.

ETH is now trading below both its 100 hourly and 200 hourly simple moving averages.

  • Ethereum trend reversal is seen below the $4,000 mark
  • Short-term range appears to be bearish for ETHUSD
  • All the moving averages are giving a STRONG SELL signal
  • The average true range is indicating LESSER market volatility

Ether Bearish Trend Below $4,000 Confirmed
etx.png


ETHUSD continues to move in a bearish channel with the price breaking below the important psychological support level of $4,000.

The relative strength index is below 50 today, which signifies a continuation of the bearish trend.

The amount of selling that is seen in Ethereum can also be attributed to the liquidation of crypto assets by global investors before the end of this financial year.

The average true range is indicating a low market volatility, and we can see an increase of 10.67% in the trading volume, as compared to yesterday.

We can also see Ethereum's decoupling from bitcoin which means that the correlation between BTC and ETH is dropping.

ETH has lost -2.67% with a price change of 107.06$ in the past 24hrs, and has a trading volume of 15.165 billion USD.

The Week Ahead

Ether is printing below the $4,000 mark today, and we can expect the downtrend to continue this week pushing its price down to the levels of $3,800 and $3,750.

The immediate short-term outlook for Ether has turned negative, but the medium to long-term outlook remains bullish with the next month target of above $5,000. The recent downturn has also led to the decline in the market capitalization of Ethereum to 467.11 billion USD.

We are now looking at the end-of-the-year market liquidation where many of the investors are selling their long-term holdings in Ethereum; they are expected to be back in the markets in the month of January 2022.

Technical Indicators:

Ultimate oscillator: at 48.80 indicating a SELL

Moving averages convergence divergence (14-day): at -19.80 indicating a SELL

StochRSI (14-day): at 26.95 indicating a SELL

Commodity channel index (14-day): at -132.99 indicating a SELL

Read Full on FXOpen Company Blog...
 
Gold Price and Crude Oil Price Could Extend Gains
Gold-price-oil-price-1.jpg


Gold price is gaining pace above the $1,800 resistance zone. Crude oil price is also rising and the bulls could attempt an upside break above $74.00.

Important Takeaways for Gold and Oil


  • Gold price is gaining pace and trading above the $1,800 zone against the US Dollar.
  • There was a break above a major bearish trend line with resistance near $1,794 on the hourly chart of gold.
  • Crude oil price started a fresh increase above the $70.00 and $72.00 levels.
  • There was a break above a key bearish trend line with resistance near $69.20 on the hourly chart of XTI/USD.

Gold Price Technical Analysis

Gold price started a fresh increase from the $1,785 support zone against the US Dollar. The price gained pace above the $1,800 level to move further into a positive zone.

The price settled well above the $1,800 level and the 50 hourly simple moving average. There was also a break above a major bearish trend line with resistance near $1,794 on the hourly chart of gold. Finally, there was a break above the $1,810 level.

Gold price hourly chart
Gold-Price-Chart-2x.jpg


A high is formed near $1,812 on FXOpen and the price is now consolidating gains. On the downside, an initial support is near the $1,807 level. It is near the 23.6% Fib retracement level of the upward move from the $1,785 swing low to $1,812 high.

The first major support is near the $1,800 level. It is near the 50% Fib retracement level of the upward move from the $1,785 swing low to $1,812 high. A downside break below the $1,800 support zone may possibly spark a steady decline. In the stated case, the price could test the $1,785 support.

On the upside, the price is facing resistance near the $1,812 level. The main resistance is near the $1,815 level. A close above the $1,815 level could open the doors for a steady increase towards $1,825. The next major resistance sits near the $1,840 level.

[Read Full on FXOpen Company Blog...
 
GBP/USD and GBP/JPY Target Additional Gains
GBPUSD-Cable-Sterling.jpg


GBP/USD started a fresh increase from the 1.3180 zone and climbed above 1.3300. GBP/JPY is also rising and trading above the 152.00 resistance.

Important Takeaways for GBP/USD and GBP/JPY


  • The British Pound started a fresh increase above the 1.3200 and 1.3300 resistance levels against the US Dollar.
  • There is a major bullish trend line forming with support near 1.3365 on the hourly chart of GBP/USD.
  • GBP/JPY also started a steady increase above the 151.50 and 152.00 resistance levels.
  • There is a key bullish trend line forming with support near 152.75 on the hourly chart.

GBP/USD Technical Analysis

After a major decline, the British Pound found support near the 1.3180 zone against the US Dollar. The GBP/USD pair started a fresh increase above the 1.3220 and 1.3300 resistance levels to move into a positive zone.

There was also a break above the 1.3350 zone and the 50 hourly simple moving average. It traded as high as 1.3427 on FXOpen and is currently consolidating gains.

GBP/USD Hourly Chart
GBPUSD-Chart-3x.jpg


There was a minor decline below the 1.3420 level. On the downside, an immediate support is near the 1.3380 level. It is near the 23.6% Fib retracement level of the upward move from the 1.3173 swing low to 1.3427 high.

There is also a major bullish trend line forming with support near 1.3365 on the hourly chart of GBP/USD. The next major support is near the 1.3300 level.

The 50% Fib retracement level of the upward move from the 1.3173 swing low to 1.3427 high is also near the 1.3300 zone. If there is a break below the 1.3300 support, the pair could test the 1.3250 support. If there are additional losses, the pair could decline towards the 1.3150 level.

On the upside, the pair is facing resistance near the 1.3420 level. A close above the 1.3420 level could open the doors for more gains. The next major hurdle is near 1.3450, above which the pair could surge towards 1.3500.

Read Full on FXOpen Company Blog...
 
BTCUSD and XRPUSD Technical Analysis – 28th DEC, 2021
btcxrp.jpg


BTCUSD: Double Top Pattern Below $52,000

Bitcoin was unable to sustain its bullish moves this week. After touching a high of $52,008, it declined to a low of 48740 in the Asian trading session today.

At present, the markets are ranging in a consolidation phase below the $50,000 handle, and we may see more downward pressure in the coming days.

Bitcoin has gone back into a bearish channel and is trading below the $50,000 handle. We can see more downsides in the range of $49,000 to $48,500 later today.

We can clearly see a double top pattern below the $52,000 level, which signifies the end of an uptrend and a shift towards a downtrend.

Both the Stoch and Williams percent ranges are indicating an OVERBOUGHT level, meaning that in the immediate short-term a decline in the prices is expected.

Bitcoin is now moving below its 100 hourly simple and exponential moving averages.

The average true range is indicating a high market volatility which means that markets are due to decline further.

  • Bitcoin trend reversal is seen below $52,000
  • Ultimate oscillator is indicating a NEUTRAL level
  • The price is now trading just above its pivot level of $49,227
  • All the moving averages are giving a STRONG SELL signal at the current market level of $49,370

Bitcoin: Bearish Reversal Below $52,000 Confirmed
btcchart.png


Bitcoin is forming a bearish trend pattern which means that the prices can start declining further due to the selling pressure that is coming into global cryptocurrency markets.

All of the major technical indicators are giving a STRONG SELL signal, which means that in the immediate short-term we are expecting targets of $49,000 and $48,000.

The price of BTCUSD is now facing its classic support level of $49,077 and Fibonacci support level of $49,111 after which the path towards $48,500 will get cleared.

In the last 24hrs, BTCUSD has gone DOWN by -2.83% with a price change of 1436$, and has a 24hr trading volume of USD 30.797 billion. We can see an Increase of 49.60% in the trading volume as compared to yesterday.

This increase in the trading volume of BTC is happening because of the increased selling pressure which, in turn, has been triggered by the end-of-the-year market liquidation and profit taking by global investors.

The Week Ahead

Bitcoin has now started its downside correction as the bears managed to bring its price below the important psychological support level of $50,000.

The short-term outlook is negative, but the medium to long-term outlooks remain BULLISH for bitcoin, with targets of $55,000 to $60,000 in 2022.

The relative strength index is below the 35 mark indicating a weaker demand for bitcoin and a heavy selling pressure in the BTCUSD market.

We can expect to see the level of $48,500 before the end of 2021.

BTC Options Market

As 2021 comes to an end, bitcoin is facing a huge options expiration on 31st Dec 2021.

Around 5.7 billion USD worth of BTC options will expire on the Deribit exchange, which will increase the liquidity in the bitcoin markets globally.
btco.jpg


The total combined value of bitcoin options will be valued at 10.7 billion USD.

Technical Indicators:

Relative strength index (14-day): at 32.33 indicating a SELL

Average directional change (14-day): at 46.25 indicating a SELL

Rate of price change: at -4.503 indicating a SELL

Moving averages convergence divergence (12,26): at -411.70 indicating a SELL

Read Full on FXOpen Company Blog...
 
EUR/USD Could Recover, EUR/JPY Extends Rally
Euro-EUR-4.jpg


EUR/USD is facing a major resistance near the 1.1335 and 1.1350 resistance levels. EUR/JPY is rising and showing positive signs above the 129.50 level.

Important Takeaways for EUR/USD and EUR/JPY


  • The Euro is struggling to gain pace for a move above the 1.1350 resistance zone.
  • There is a key bullish trend line forming with support near 1.1300 on the hourly chart.
  • EUR/JPY gained pace for a strong move above the 130.00 resistance level.
  • There was a break below a major bullish trend line with support near 129.80 on the hourly chart.

EUR/USD Technical Analysis

The Euro made a few attempts to gain strength above the 1.1335 and 1.1350 resistance levels against the US Dollar. The EUR/USD pair struggled to gain pace and started a fresh decline from the 1.1335 zone.

The pair traded below the 1.1320 support and settled below the 50 hourly simple moving average. A low was formed near 1.1290 on FXOpen and the pair is now correcting losses. There was a break above the 1.1300 level.

EUR/USD Hourly Chart
EURUSD-Chart-4x.jpg


The pair spiked above the 50% Fib retracement level of the downward move from the 1.1335 swing high to 1.1290 low.

It is now facing resistance near the 1.1310 level. The next major resistance is near the 1.1320 level. It is near the 76.4% Fib retracement level of the downward move from the 1.1335 swing high to 1.1290 low. The main resistance is forming near the 1.1335 and 1.1350 levels.

A clear break above the 1.1350 resistance could push EUR/USD towards 1.1400. On the downside, the 1.1300 level is a major support. There is also a key bullish trend line forming with support near 1.1300 on the hourly chart.

Any more losses might lead EUR/USD towards the 1.1220 support zone in the near term. The next major support sits near the 1.1200 level.

Read Full on FXOpen Company Blog...
 
Inflation fears rising as 6% looks possible: Will interest rates rise?
boex.jpg


Today is the first working day for many people within the world's most developed financial markets centers after the festive holidays, and among predictions of interesting potential market movements for the year ahead and optimism relating to interesting new blockchain technology which is part of the revolutionary direction in finance at the moment, a nagging elephant in the room lurks.

That elephant in the room is inflation, that age-old consideration which, no matter how high the technology that powers the world's financial system these days has become, is a metric that still remains one of the most important measures of economic circumstances.

As the markets begin to open across Europe today for the first time in a few days, many analysts are predicting further rises in inflation, which in the United Kingdom, one of the world's largest financial markets economies and home to the most valuable major currency in the world - the Pound - has been at an 11 year high of 5.1% for a few weeks.

Today's rather alarming predictions from Resolution Foundation, which is a government think tank, have demonstrated that inflation could rise to 6% in the United Kingdom, a rate which has already been reached in the United States. Should this happen, it would be the highest inflation Britain's economy will have experienced since 1992.

Should this occur, the economy will likely be affected by a combination of stalled real wages and rising costs of services and everyday products, and if Resolution Foundation's predictions are correct and a 6% rate of inflation occurs by April 2022, the average British household's costs are likely to rise by approximately £1,200 which will be another woe to accompany the energy price rises and tax hikes that have been noticeable over recent months.

Resolution Foundation's 11-page report which was published this morning explains that the beginning of the year is likely to be a period in which the pressure on living standards that many households are already facing could evolve in an environment in which price rises outstrip pay growth.

The think tank has branded the Spring of 2022 to be a period of a 'broad-based cost of living catastrophe affecting the vast majority of households'

Looking forward a few years, it is possible that real wages could be £740 per year lower than they would have been if there had been no lockdowns or disruptions to the economy since March 2020.

Where does this leave interest rates?

So far, the Bank of England has not increased interest rates, despite that being a priority subject at the Bank of England meetings recently.

Perhaps this is because the Bank of England understands that when interest rates are increased, it potentially cripples the economy. The last time this was done in ernest was in 1991 when the interest rate was over 10% and mass home repossessions took place due to mortgage payment unaffordability.

The Bank of England has tried to stave that off so far, however the question remains as to how long businesses can swallow the cost of inflation and not be able to pass it on to their already cash-strapped customers.

Interestingly, the Pound is up against the US Dollar this morning at 1.34, showing that the currency markets are not fazed by this news.

The same applies to the Pound's value against the Euro, which is now at 1.19. These increases in values by the Pound against its major counterparts occurred specifically as the news broke, which is interesting considering that the British economy could be in serious trouble this coming year.

Perhaps those with an analytical focus have noticed that the United States has been battling with even higher inflation for some time now yet it has not become a flagging economy to the extent that such a high rate of inflation has caused in the past... yet!

Given the uncertainty of the effect of these high levels of inflation in a modern world in which the financial economy is very different to how it was 30 years ago, the way it will be overcome is unknown. Perhaps comparisons with the Eurozone and the US have paved the way for a reasonably buoyant Pound which appears to have gone the opposite way to what would be expected on the arrival of such news.

Additionally, there has been no lockdown in England, whereas there has in Scotland and Wales, when many were expecting the British government to lock down the entire United Kingdom as a routine matter of course, which did not happen.

The hospitality businesses across England are about to welcome a deluge of residents of Wales and Scotland who have vowed to go across the border to celebrate New Year, giving that industry a much needed boost.

Perhaps 2022 will be a year of volatility and changing circumstances. Either way, this is a very interesting start and something of a white knuckle ride.

FXOpen Blog
 
ETHUSD and LTCUSD Technical Analysis – 30th DEC, 2021
dc.jpg


ETHUSD – Rounding Bottom Pattern Above $3,600

Ethereum continued its bearish trend this week, and touched a low of $3,584 in the Asian trading session today, after which the prices have stabilized above the $3,600 handle.

Most of the selling witnessed in Ethereum was due to the end-of-the-year profit-taking by long-term investors, and at current levels, we can now see some buying in the markets.

ETHUSD continues to recover from its losses today and entered into a consolidation phase above $3,600.

We can clearly see a rounding bottom pattern above the $3,600 handle which signifies a trend reversal towards a bullish uptrend.

ETH is now trading just below its pivot levels of $3,706 and moving in a bullish consolidation channel. The price of ETHUSD is about to break its classic resistance level of $3,722 and its Fibonacci resistance level of $3,734, after which the path towards $3,800 will get cleared.

All the major technical indicators are giving a BUY signal.

ETH is now trading below both the 100 hourly and 200 hourly simple moving averages.

  • Ethereum trend reversal is seen above the $3,600 mark
  • Short-term range appears to be mildly bullish for ETHUSD
  • Commodity channel index is indicating a NEUTRAL market
  • Average true range is indicating LESS market volatility

Ether: Mild Bullish Trend Reversal seen Above $3,600
eth.png


ETHUSD is on its way to recover from its losses this week, and has entered into a consolidation phase above $3,600.

We can see a mildly bullish channel in progression today which if confirmed will push the prices of ETHUSD above $3,800 before the end of 2021.

Overall market scenario for Ethereum appears to be NEUTRAL.

StochRSI is indicating an OVERBOUGHT level which means more downward correction could also take place in the prices before the start of an upswing trend.

The average true range is indicating low market volatility, and we can see an increase of 12.16% in the trading volume as compared to yesterday.

ETH has lost -2.00% with a price change of -75.26$ in the past 24hrs and has a trading volume of 17.005 billion USD.

The Week Ahead

Ether is slowly recovering from its losses, and the price continues to uptick in the European trading session today.

We have detected an MA 10 and MA 5 crossover pattern which indicates a bullish reversal of the trend, and if this pattern continues, we can test levels of $3,800 to $3,850 very soon.

The immediate short-term outlook for Ether has turned positive; the medium to long-term outlook for Ether remain bullish with the target of above $5,000 in January 2022

The recent downturn has also led to the decline in the market capitalization of Ethereum to 439.44 billion USD.

Ethereum's Transformation in 2022

In 2022, Ethereum will transition to Proof of Stake, which will bring in many advantages to the underlying network. The most notable are lower energy consumption, decentralization and scalability.

The change to the Proof of Stake will eliminate Ethereum's mining and reduce the power consumption required to sustain the network. This change is expected to bring down the total energy level consumption by 99%. The change will also implement sharding and scalability that will lower the transaction costs of Ethereum.

Technical Indicators:

Ultimate oscillator: at 54.93 indicating a BUY

STOCH (9,6): at 66.95 indicating a BUY

Williams percent range: at -37.68 indicating a BUY

Average directional change (14-day): at 36.62 indicating a BUY

Read Full on FXOpen Company Blog...
 
GBP/USD Gains Momentum While EUR/GBP Eyes Recovery
GBPUSD-Sterling-1.jpg


GBP/USD gained pace and there was a move above the 1.3500 resistance. EUR/GBP is attempting an upside break above the 0.8420 resistance zone.

Important Takeaways for GBP/USD and EUR/GBP


  • The British Pound started a steady upward move above the 1.3450 and 1.3480 levels.
  • There is a key rising channel forming with support near 1.3490 on the hourly chart of GBP/USD.
  • EUR/GBP found support near 0.8365 and started a recovery wave.
  • There was a break above a major bearish trend line with resistance near 0.8400 on the hourly chart.

GBP/USD Technical Analysis

The British Pound formed a support base above the 1.3400 zone against the US Dollar. The GBP/USD pair started a steady upward move after it broke the 1.3450 resistance zone.

The pair recovered above the 1.3500 resistance level and the 50 hourly simple moving average. A high was formed near 1.3550 and the pair is now correcting gains. There was a break below the 1.3540 and 1.3520 levels.

GBP/USD Hourly Chart
GBPUSD-Chartx.jpg


The pair traded below the 50% Fib retracement level of the upward move from the 1.3465 low to 1.3550 high. The pair is now trading near the 1.3500 level.

There is also a key rising channel forming with support near 1.3490 on the hourly chart of GBP/USD. The channel is near the 61.8% Fib retracement level of the upward move from the 1.3465 low to 1.3550 high.

On the upside, an initial resistance is near the 1.3520 level. If there is an upside break above the 1.3520 resistance, the price could surpass 1.3550. The next main resistance is near the 1.3600 zone.

If there is no upside break, the pair could start a fresh decline below 1.3500. An immediate support is near the 1.3480 level.

The first key support is near the 1.3450 level. Any more losses could lead the pair towards the 1.3400 support zone. The next major support sits near the 1.3320 level.

Read Full on FXOpen Company Blog...
 
Back
Top Bottom