FXOpen Trader
Well-known member
GBP/USD and USD/CAD Could Extend Gains

GBP/USD started a steady increase and surpassed the 1.3600 resistance. USD/CAD is holding gains above 1.2700 and eyeing more gains.
Important Takeaways for GBP/USD and USD/CAD
GBP/USD Technical Analysis

The British Pound formed a strong support base above the 1.3500 level against the US Dollar. As a result, the GBP/USD pair started a decent increase and it broke many hurdles near 1.3550.
The pair gained pace above the 1.3580 level and the 50 hourly simple moving average. The pair even spiked above the 1.3600 resistance zone. A high is formed near 1.3642 on FXOpen and the pair is now consolidating gains.
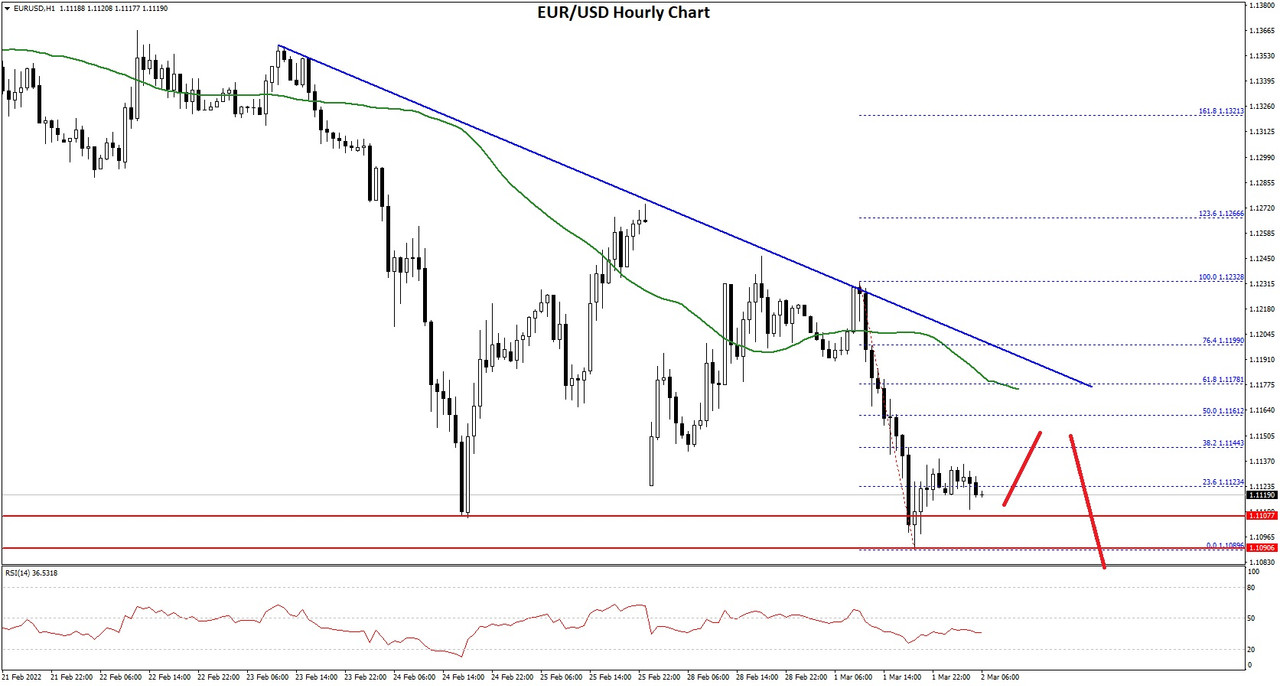
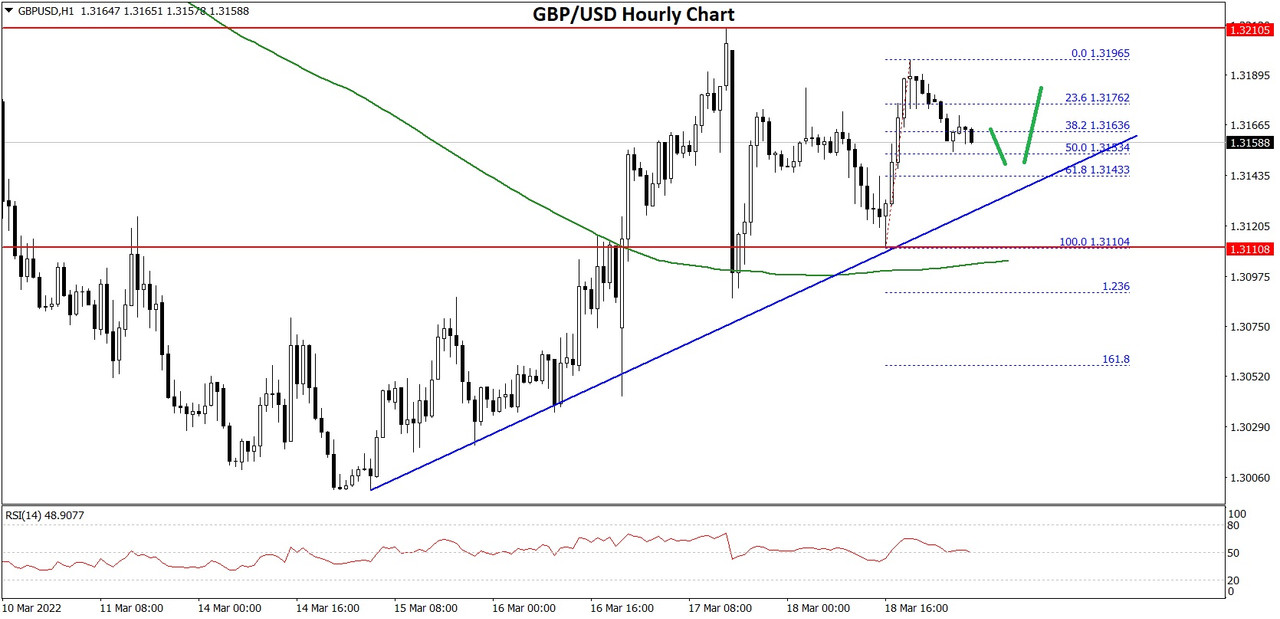
GBP/USD Hourly Chart
There was a move below the 23.6% Fib retracement level of the upward move from the 1.3486 swing low to 1.3642 high. An initial support on the downside is near the 1.3605 level and the 50 hourly simple moving average.
The main support is now forming near the 1.3590 level. There is also a key bullish trend line forming with support near 1.3590 on the hourly chart of GBP/USD.
The trend line is also above the 50% Fib retracement level of the upward move from the 1.3486 swing low to 1.3642 high. If there is a downside break, GBP/USD might test the 1.3520 support.
On the upside, the pair must settle above the 1.3630 level. The next major resistance is near the 1.3650 level. Any more gains could lead the pair towards the 1.3800 barrier in the near term. An intermediate resistance could be 1.3740.
Read Full on FXOpen Company Blog...
GBP/USD started a steady increase and surpassed the 1.3600 resistance. USD/CAD is holding gains above 1.2700 and eyeing more gains.
Important Takeaways for GBP/USD and USD/CAD
- The British Pound started a fresh increase from the 1.3500 support zone.
- There is a key bullish trend line forming with support near 1.3590 on the hourly chart of GBP/USD.
- USD/CAD seems to be facing resistance near the 1.2760 and 1.2780 resistance levels.
- There is a major bearish trend line forming with resistance near 1.2755 on the hourly chart.
GBP/USD Technical Analysis
The British Pound formed a strong support base above the 1.3500 level against the US Dollar. As a result, the GBP/USD pair started a decent increase and it broke many hurdles near 1.3550.
The pair gained pace above the 1.3580 level and the 50 hourly simple moving average. The pair even spiked above the 1.3600 resistance zone. A high is formed near 1.3642 on FXOpen and the pair is now consolidating gains.
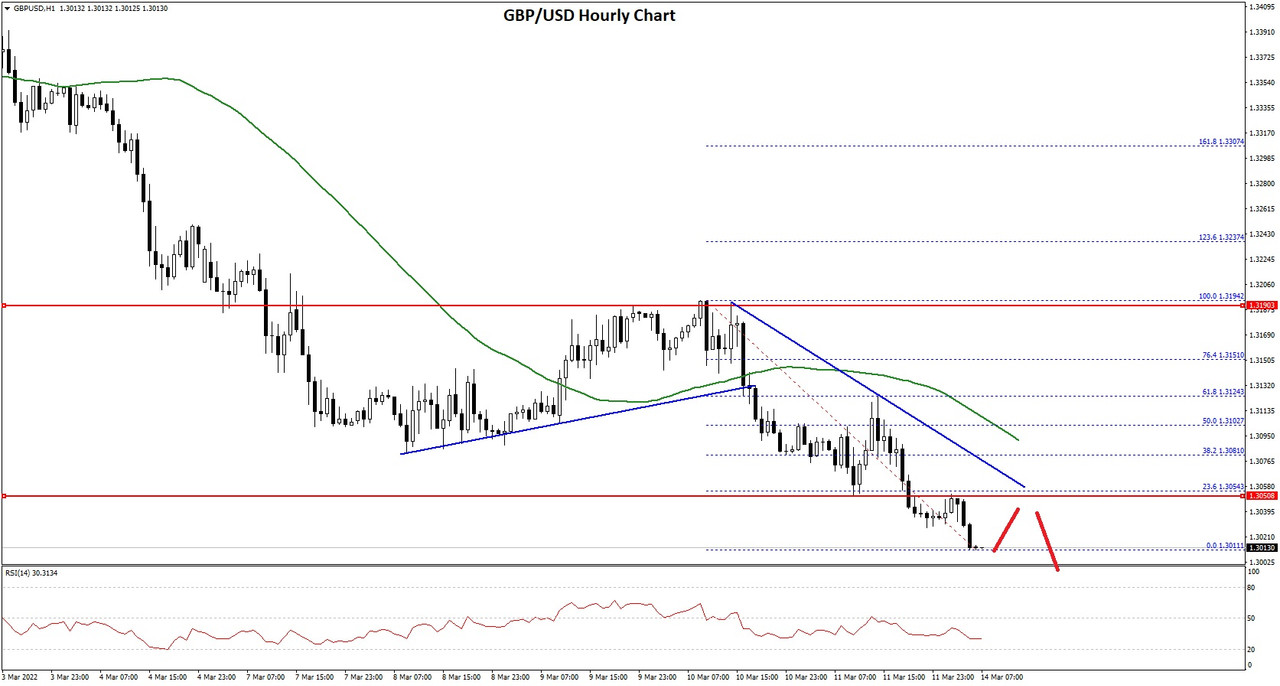
GBP/USD Hourly Chart
There was a move below the 23.6% Fib retracement level of the upward move from the 1.3486 swing low to 1.3642 high. An initial support on the downside is near the 1.3605 level and the 50 hourly simple moving average.
The main support is now forming near the 1.3590 level. There is also a key bullish trend line forming with support near 1.3590 on the hourly chart of GBP/USD.
The trend line is also above the 50% Fib retracement level of the upward move from the 1.3486 swing low to 1.3642 high. If there is a downside break, GBP/USD might test the 1.3520 support.
On the upside, the pair must settle above the 1.3630 level. The next major resistance is near the 1.3650 level. Any more gains could lead the pair towards the 1.3800 barrier in the near term. An intermediate resistance could be 1.3740.
Read Full on FXOpen Company Blog...