
• Attention Forex Brokers, FX Companies & Hedge Funds.

    forum.forex is available for Acquisition (quick sale)

    Submit your Offer

Daily Market Analytics - Forex

EURUSD Technical Analysis – 30 JULY, 2026
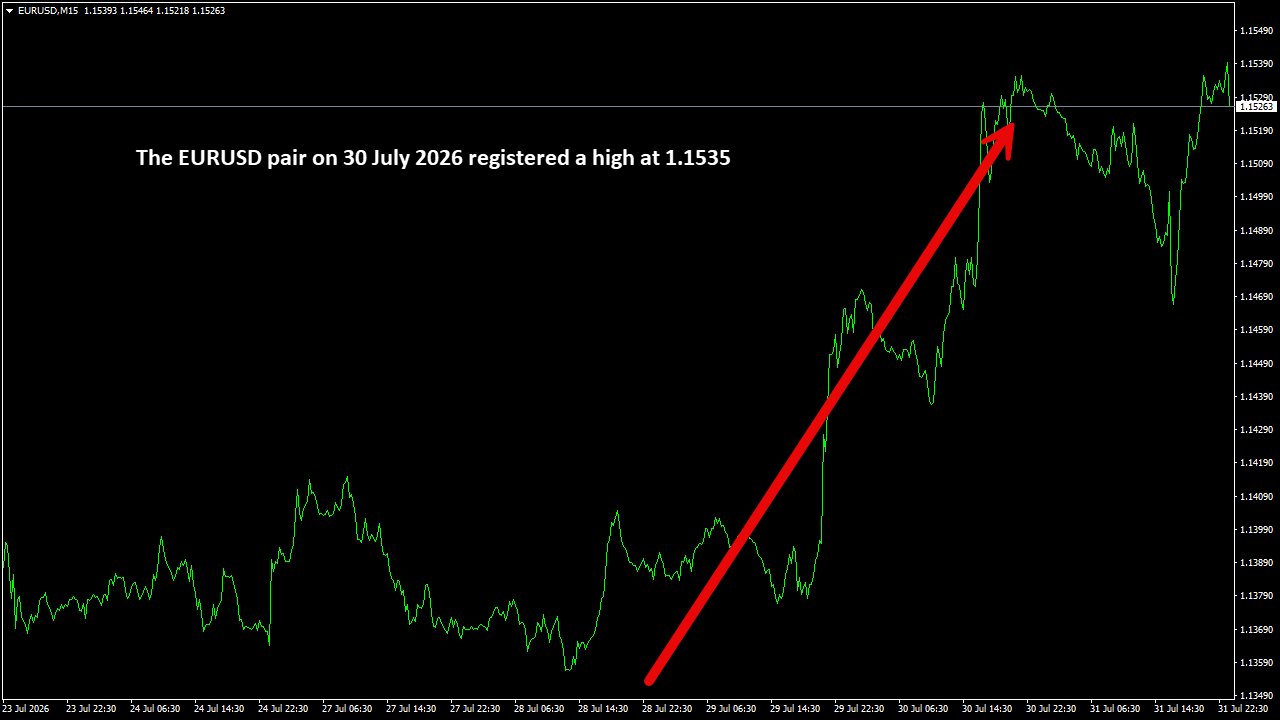
EURUSD – The EURUSD pair on 30 July 2026 registered a high at 1.1535
EURUSDM15.png


The EURUSD pair on 30 July 2026 registered a high at 1.1535, a level that underscores the euro’s resilience against the U.S. dollar and highlights the continuation of a recovery phase that has been unfolding since late July. This high is technically significant because it extends the rally beyond the mid-July ceiling around 1.1500–1.1510, confirming that buyers remain firmly in control. The 1.1535 print sits just beneath the psychological 1.1550 barrier, a level that traders often treat as a key resistance point, making this high both a confirmation of strength and a potential inflection zone.

On the daily chart, EURUSD has been trending within a moderately ascending channel since late June, with price action pressing against the upper boundary. The 1.1535 high coincides with this channel resistance, reinforcing its importance as a technical marker. Momentum indicators reflect the intensity of the move: RSI has climbed into the 66–70 range, approaching overbought territory but still leaving room for further upside. The MACD histogram remains positive, with widening divergence between the signal and MACD lines, suggesting that bullish momentum is accelerating. These readings point to continued strength, though they also highlight the need for confirmation through sustained closes above 1.1535–1.1550.

Support levels are well-defined and critical to monitor. The immediate cushion lies around 1.1500–1.1510, a zone that aligns with prior breakout levels and the 20-day moving average. A deeper retracement could test 1.1460, where demand has consistently emerged in recent weeks. On the upside, resistance is clearly defined at 1.1550–1.1570, a band that represents both psychological and structural barriers. A sustained close above this zone would open the path toward 1.1600, a level that could attract further bullish interest. Until then, rallies are likely to be capped, with traders cautious about chasing momentum without confirmation beyond 1.1535.

Fundamentally, the euro’s strength against the dollar reflects a combination of monetary policy divergence and global risk sentiment. The European Central Bank’s cautious but steady approach has provided support, while the Federal Reserve’s restrictive stance continues to bolster dollar demand through elevated yields. However, stabilizing global risk sentiment has reduced the dollar’s safe-haven appeal, allowing the euro to regain ground. Concerns about slowing U.S. growth and expectations of eventual policy recalibration by the Fed have further tempered dollar strength, creating space for the euro’s recovery. This macro backdrop explains why EURUSD has managed to push above 1.1500, with the 1.1535 high serving as a manifestation of these underlying forces.

In broader context, the 1.1535 high represents both opportunity and caution. For bulls, it confirms the strength of the prevailing trend and offers a springboard toward higher targets, potentially extending toward 1.1600 in the medium term. For bears, it signals a potential exhaustion point, particularly given proximity to psychological resistance and the need for sustained momentum. The coming sessions will determine whether EURUSD consolidates below 1.1550 or breaks decisively higher, setting the tone for early August trading. Ultimately, the 1.1535 high encapsulates the euro’s resilience and the dollar’s tempered dominance, a dynamic that continues to define the pair’s trajectory and offers traders both risk and reward in equal measure.

#fxopen #forex #forexanalysis

Disclaimer: This analysis represents my own opinion only. It is not to be construed as an opinion, offer, solicitation, recommendation, or financial advice of the Companies operating under the FXOpen brand.
 
GBPJPY Technical Analysis – 30 JULY, 2026
GBPJPY – The GBPJPY pair on 30 July 2026 registered a high at 218.61

GBPJPYM15.png


The GBPJPY pair on 30 July 2026 registered a high at 218.61, a level that underscores sterling’s continued dominance against the yen and highlights the persistence of a powerful bullish trend. This high is technically significant because it extends the rally beyond the mid-July ceiling around 218.00, confirming that buyers remain firmly in control. The 218.61 print sits just beneath the psychological 219.00 barrier, a level that traders often treat as a key resistance point, making this high both a confirmation of strength and a potential inflection zone.

On the daily chart, GBPJPY has been trending within a steep ascending channel since early June, with price action consistently pressing against the upper boundary. The 218.61 high coincides with this channel resistance, reinforcing its importance as a technical marker. Momentum indicators reflect the intensity of the move: RSI has surged into the 72–75 range, firmly in overbought territory, while MACD continues to show strong positive divergence. These readings suggest that while bullish momentum remains intact, the risk of short-term corrective pullbacks is elevated, particularly as traders reassess the sustainability of such aggressive gains.

Support levels are well-defined and critical to monitor. The immediate cushion lies around 217.00–217.20, a zone that aligns with the 20-day moving average and prior breakout levels. A deeper retracement could test 215.40–215.60, where demand has consistently emerged in recent weeks. On the upside, a sustained break above 218.61 would open the path toward 220.00–221.00, a resistance band that represents both psychological and structural barriers. A decisive close above 219.00 would embolden bulls, potentially extending the rally toward 222.00 in the medium term. Until then, traders will be cautious about chasing the rally without confirmation of sustained momentum beyond 218.60.

Fundamentally, sterling’s strength against the yen reflects divergent monetary policy stances and relative yield dynamics. The Bank of England’s hawkish tilt, driven by persistent inflationary pressures, has bolstered sterling demand, while the Bank of Japan’s commitment to ultra-loose policy has kept the yen under heavy pressure. This yield differential has fuelled carry trade flows, with investors favouring sterling over yen. Additionally, global risk sentiment has remained relatively stable, reducing demand for the yen’s safe-haven qualities and further amplifying its weakness. This macro backdrop explains why GBPJPY has surged to such elevated levels, with the 218.61 high serving as a manifestation of these underlying forces.

In broader context, the 218.61 high represents both opportunity and caution. For bulls, it confirms the strength of the prevailing trend and offers a springboard toward higher targets, potentially extending toward 222.00 in the medium term. For bears, it signals a potential exhaustion point, particularly given overbought momentum readings and proximity to psychological resistance. The coming sessions will determine whether GBPJPY consolidates below 219.00 or breaks decisively higher, setting the tone for early August trading. Ultimately, the 218.61 high encapsulates sterling’s dominance and the yen’s vulnerability, a dynamic that continues to define the pair’s trajectory and offers traders both risk and reward in equal measure.

#fxopen #forex #forexanalysis

Disclaimer: This analysis represents my own opinion only. It is not to be construed as an opinion, offer, solicitation, recommendation, or financial advice of the Companies operating under the FXOpen brand.
 
GBPUSD Technical Analysis – 30 JULY, 2026
GBPUSD – The GBPUSD pair on 30 July 2026 registered a low at 1.3287

GBPUSDM15.png


The GBPUSD pair on 30 July 2026 registered a low at 1.3287, a level that reflects renewed dollar strength and underscores the corrective pressure weighing on sterling after its recent attempts to recover. This low is technically significant because it marks a retreat beneath the mid-July support zone around 1.3300–1.3320, where buyers had previously defended the downside. The move down to 1.3287 suggests that sellers have regained control, testing the resilience of support levels that have underpinned the pair’s trajectory in recent weeks.

On the daily chart, GBPUSD remains within a moderately ascending channel that has guided price action since late June, but the 1.3287 low coincides with the lower boundary of this channel, reinforcing its importance as a technical marker. Momentum indicators reflect the cooling of bullish momentum: RSI has slipped into the 46–50 range, signalling growing downside pressure without yet reaching oversold conditions. The MACD histogram has narrowed, with convergence between the MACD and signal lines, suggesting that momentum is fading and bearish sentiment is beginning to dominate. These readings point to vulnerability, with the potential for deeper declines if support levels fail to hold.

Support zones are clearly defined and critical to monitor. The immediate cushion lies around 1.3260–1.3270, a region that aligns with prior demand clusters and the 50-day moving average. A decisive break below this area would expose the pair to deeper retracement toward 1.3220, a psychological level that represents both structural support and a historical pivot. On the upside, resistance is now set at 1.3320–1.3340, where failed rallies have repeatedly stalled. A sustained close above this zone would be required to neutralize the bearish bias and reestablish bullish momentum. Until then, rallies are likely to be capped, with sellers viewing them as opportunities to re-enter short positions.

Fundamentally, sterling’s weakness against the dollar reflects a combination of monetary policy divergence and shifting risk sentiment. The Bank of England’s hawkish tilt has provided some support, but persistent inflationary pressures and slowing UK growth have tempered enthusiasm. Meanwhile, the Federal Reserve’s restrictive stance continues to bolster dollar demand through elevated yields. Global risk sentiment has also played a role, with investors showing renewed preference for the dollar amid concerns about geopolitical uncertainty and uneven global growth. This macro backdrop explains why GBPUSD has struggled to sustain gains above 1.3350, with the 1.3287 low serving as a manifestation of these underlying forces.

In broader context, the 1.3287 low represents both a test of resilience and a potential springboard. For bears, it confirms the resumption of downward momentum and opens the path toward deeper retracement, potentially extending toward 1.3220 in the medium term. For bulls, it serves as a challenge, highlighting the need to defend key support zones to prevent a more pronounced decline. The coming sessions will determine whether GBPUSD stabilizes above 1.3280 or continues to slide, with the outcome likely shaped by central bank commentary and global risk appetite. Ultimately, the 1.3287 low encapsulates the balance between sterling fragility and dollar dominance, a dynamic that continues to define the pair’s near-term outlook.

#fxopen #forex #forexanalysis

Disclaimer: This analysis represents my own opinion only. It is not to be construed as an opinion, offer, solicitation, recommendation, or financial advice of the Companies operating under the FXOpen brand.
 
NZDUSD Technical Analysis – 30 JULY, 2026
NZDUSD – The NZDUSD pair on 30 July 2026 registered a high at 0.5883

NZDUSDM15.png


The NZDUSD pair on 30 July 2026 registered a high at 0.5883, a level that underscores the New Zealand dollar’s attempt to regain ground against the U.S. dollar and highlights the continuation of a corrective rebound after weeks of sustained weakness. This high is technically significant because it extends the rally beyond the mid-July ceiling around 0.5850–0.5860, confirming that buyers have managed to push the pair above short-term resistance. The 0.5883 print sits just beneath the psychological 0.5900 barrier, a level that traders often treat as a key pivot, making this high both a confirmation of strength and a potential inflection zone.

On the daily chart, NZDUSD has been trending within a descending channel since early June, but the 0.5883 high coincides with the upper boundary of this channel, reinforcing its importance as a technical marker. Momentum indicators reflect the intensity of the rebound: RSI has climbed into the 58–62 range, signalling improving bullish momentum without yet reaching overbought conditions. The MACD histogram has turned positive, with widening divergence between the signal and MACD lines, suggesting that bullish momentum is accelerating. These readings point to continued strength, though they also highlight the need for confirmation through sustained closes above 0.5880–0.5900.

Support levels are well-defined and critical to monitor. The immediate cushion lies around 0.5840–0.5850, a zone that aligns with prior breakout levels and the 20-day moving average. A deeper retracement could test 0.5800, where demand has consistently emerged in recent weeks. On the upside, resistance is clearly defined at 0.5900–0.5920, a band that represents both psychological and structural barriers. A sustained close above this zone would open the path toward 0.5950–0.6000, levels that could attract further bullish interest. Until then, rallies are likely to be capped, with traders cautious about chasing momentum without confirmation beyond 0.5883.

Fundamentally, the New Zealand dollar’s strength against the U.S. dollar reflects a combination of commodity price dynamics, monetary policy divergence, and global risk sentiment. The Reserve Bank of New Zealand’s cautious but steady stance has provided some support, while stabilizing dairy and commodity prices have bolstered the kiwi’s appeal. Meanwhile, the Federal Reserve’s restrictive stance continues to underpin dollar demand through elevated yields, but moderating U.S. growth expectations have tempered its dominance. Global risk sentiment has also played a role, with investors showing renewed preference for higher-yielding currencies amid easing geopolitical concerns. This macro backdrop explains why NZDUSD has managed to push above 0.5850, with the 0.5883 high serving as a manifestation of these underlying forces.

In broader context, the 0.5883 high represents both opportunity and caution. For bulls, it confirms the strength of the corrective rebound and offers a springboard toward higher targets, potentially extending toward 0.5950–0.6000 in the medium term. For bears, it signals a potential exhaustion point, particularly given proximity to psychological resistance and the need for sustained momentum. The coming sessions will determine whether NZDUSD consolidates below 0.5900 or breaks decisively higher, setting the tone for early August trading. Ultimately, the 0.5883 high encapsulates the kiwi’s resilience and the dollar’s tempered dominance, a dynamic that continues to define the pair’s trajectory and offers traders both risk and reward in equal measure.

#fxopen #forex #forexanalysis

Disclaimer: This analysis represents my own opinion only. It is not to be construed as an opinion, offer, solicitation, recommendation, or financial advice of the Companies operating under the FXOpen brand.
 
USDCAD Technical Analysis – 30 JULY, 2026
USDCAD – The USDCAD pair on 30 July 2026 registered a low at 1.3991

USDCADM15.png


The USDCAD pair on 30 July 2026 registered a low at 1.3991, a level that underscores the Canadian dollar’s resilience against the U.S. dollar and highlights the corrective pressure weighing on the greenback after its recent rally. This low is technically significant because it marks a retreat beneath the mid-July support zone around 1.4010–1.4020, where buyers had previously defended the downside. The move down to 1.3991 suggests that sellers have regained control, testing the durability of support levels that have historically acted as pivots for price action.

On the daily chart, USDCAD remains within a moderately ascending channel that has guided price action since early July, but the 1.3991 low coincides with the lower boundary of this channel, reinforcing its importance as a technical marker. Momentum indicators reflect the cooling of bullish momentum: RSI has slipped into the 44–48 range, signalling growing downside pressure without yet reaching oversold conditions. The MACD histogram has narrowed, with convergence between the MACD and signal lines, suggesting that momentum is fading and bearish sentiment is beginning to dominate. These readings point to vulnerability, with the potential for deeper declines if support levels fail to hold.

Support zones are clearly defined and critical to monitor. The immediate cushion lies around 1.3980–1.3990, a region that aligns with prior demand clusters and the 50-day moving average. A decisive break below this area would expose the pair to deeper retracement toward 1.3940, a psychological level that represents both structural support and a historical pivot. On the upside, resistance is now set at 1.4020–1.4040, where failed rallies have repeatedly stalled. A sustained close above this zone would be required to neutralize the bearish bias and reestablish bullish momentum. Until then, rallies are likely to be capped, with sellers viewing them as opportunities to re-enter short positions.

Fundamentally, the Canadian dollar’s strength against the U.S. dollar reflects a combination of commodity price dynamics, monetary policy divergence, and global risk sentiment. Crude oil prices, a key driver of CAD performance, have stabilized at elevated levels, bolstering demand for the currency. Meanwhile, the Bank of Canada’s relatively hawkish stance has reinforced confidence in the CAD, while the Federal Reserve’s restrictive policy continues to underpin dollar demand. However, moderating U.S. growth expectations and easing risk aversion have tempered the dollar’s dominance, creating space for the Canadian dollar’s recovery. This macro backdrop explains why USDCAD has slipped to 1.3991, with the low serving as a manifestation of these underlying forces.

In broader context, the 1.3991 low represents both a test of resilience and a potential springboard. For bears, it confirms the resumption of downward momentum and opens the path toward deeper retracement, potentially extending toward 1.3940 in the medium term. For bulls, it serves as a challenge, highlighting the need to defend key support zones to prevent a more pronounced decline. The coming sessions will determine whether USDCAD stabilizes above 1.3990 or continues to slide, with the outcome likely shaped by oil price trends and central bank commentary. Ultimately, the 1.3991 low encapsulates the balance between Canadian dollar resilience and U.S. dollar fragility, a dynamic that continues to define the pair’s near-term outlook.

#fxopen #forex #forexanalysis

Disclaimer: This analysis represents my own opinion only. It is not to be construed as an opinion, offer, solicitation, recommendation, or financial advice of the Companies operating under the FXOpen brand.q
 
USDCHF Technical Analysis – 30 JULY, 2026
USDCHF – The USDCHF pair on 30 July 2026 registered a low at 0.8040

USDCHFM15.png


The USDCHF pair on 30 July 2026 registered a low at 0.8040, a level that underscores the Swiss franc’s resilience against the U.S. dollar and highlights the corrective pressure weighing on the greenback after its recent rally. This low is technically significant because it marks a retreat beneath the mid-July support zone around 0.8060–0.8070, where buyers had previously defended the downside. The move down to 0.8040 suggests that sellers have regained control, testing the durability of support levels that have historically acted as pivots for price action.

On the daily chart, USDCHF remains within a moderately ascending channel that has guided price action since early July, but the 0.8040 low coincides with the lower boundary of this channel, reinforcing its importance as a technical marker. Momentum indicators reflect the cooling of bullish momentum: RSI has slipped into the 42–46 range, signalling growing downside pressure without yet reaching oversold conditions. The MACD histogram has narrowed, with convergence between the MACD and signal lines, suggesting that momentum is fading and bearish sentiment is beginning to dominate. These readings point to vulnerability, with the potential for deeper declines if support levels fail to hold.

Support zones are clearly defined and critical to monitor. The immediate cushion lies around 0.8020–0.8040, a region that aligns with prior demand clusters and the 50-day moving average. A decisive break below this area would expose the pair to deeper retracement toward 0.7980, a psychological level that represents both structural support and a historical pivot. On the upside, resistance is now set at 0.8080–0.8100, where failed rallies have repeatedly stalled. A sustained close above this zone would be required to neutralize the bearish bias and reestablish bullish momentum. Until then, rallies are likely to be capped, with sellers viewing them as opportunities to re-enter short positions.

Fundamentally, the franc’s strength against the dollar reflects a combination of monetary policy divergence and global risk sentiment. The Swiss National Bank’s cautious but steady stance has bolstered the franc’s appeal, particularly as investors continue to view it as a safe-haven currency. Meanwhile, the Federal Reserve’s restrictive stance continues to underpin dollar demand, but moderating U.S. growth expectations and easing risk aversion have tempered its dominance. Global risk sentiment has also played a role, with investors showing renewed preference for the franc amid concerns about geopolitical uncertainty and uneven global growth. This macro backdrop explains why USDCHF has struggled to sustain gains above 0.8100, with the 0.8040 low serving as a manifestation of these underlying forces.

In broader context, the 0.8040 low represents both a test of resilience and a potential springboard. For bears, it confirms the resumption of downward momentum and opens the path toward deeper retracement, potentially extending toward 0.7980 in the medium term. For bulls, it serves as a challenge, highlighting the need to defend key support zones to prevent a more pronounced decline. The coming sessions will determine whether USDCHF stabilizes above 0.8040 or continues to slide, with the outcome likely shaped by central bank commentary and global risk appetite. Ultimately, the 0.8040 low encapsulates the balance between franc strength and dollar fragility, a dynamic that continues to define the pair’s near-term outlook.

#fxopen #forex #forexanalysis

Disclaimer: This analysis represents my own opinion only. It is not to be construed as an opinion, offer, solicitation, recommendation, or financial advice of the Companies operating under the FXOpen brand.
 
USDJPY Technical Analysis – 30 JULY, 2026
USDJPY - The USDJPY pair on 30 July 2026 registered a low at 158.51

USDJPYM15.png


The USDJPY pair on 30 July 2026 registered a low at 158.51, a level that underscores the yen’s resilience against the U.S. dollar and highlights the corrective pressure weighing on the greenback after its recent surge. This low is technically significant because it marks a retreat beneath the mid-July support zone around 159.20–159.50, where buyers had previously defended the downside. The move down to 158.51 suggests that sellers have regained control, testing the durability of support levels that have historically acted as pivots for price action.

On the daily chart, USDJPY remains within a steep ascending channel that has guided price action since early June, but the 158.51 low coincides with the lower boundary of this channel, reinforcing its importance as a technical marker. Momentum indicators reflect the cooling of bullish momentum: RSI has slipped into the 44–48 range, signalling growing downside pressure without yet reaching oversold conditions. The MACD histogram has narrowed, with convergence between the MACD and signal lines, suggesting that momentum is fading and bearish sentiment is beginning to dominate. These readings point to vulnerability, with the potential for deeper declines if support levels fail to hold.

Support zones are clearly defined and critical to monitor. The immediate cushion lies around 158.40–158.50, a region that aligns with prior demand clusters and the 50-day moving average. A decisive break below this area would expose the pair to deeper retracement toward 157.80, a psychological level that represents both structural support and a historical pivot. On the upside, resistance is now set at 159.50–159.80, where failed rallies have repeatedly stalled. A sustained close above this zone would be required to neutralize the bearish bias and reestablish bullish momentum. Until then, rallies are likely to be capped, with sellers viewing them as opportunities to re-enter short positions.

Fundamentally, the yen’s strength against the dollar reflects a combination of monetary policy divergence and global risk sentiment. While the Federal Reserve’s restrictive stance continues to underpin dollar demand through elevated yields, moderating U.S. growth expectations have tempered its dominance. Meanwhile, the Bank of Japan’s ultra-loose policy remains intact, but the yen has benefited from renewed safe-haven demand amid concerns about global growth and geopolitical uncertainty. This macro backdrop explains why USDJPY has struggled to sustain gains above 160.00, with the 158.51 low serving as a manifestation of these underlying forces.

In broader context, the 158.51 low represents both a test of resilience and a potential springboard. For bears, it confirms the resumption of downward momentum and opens the path toward deeper retracement, potentially extending toward 157.80 in the medium term. For bulls, it serves as a challenge, highlighting the need to defend key support zones to prevent a more pronounced decline. The coming sessions will determine whether USDJPY stabilizes above 158.50 or continues to slide, with the outcome likely shaped by central bank commentary and global risk appetite. Ultimately, the 158.51 low encapsulates the balance between yen resilience and dollar fragility, a dynamic that continues to define the pair’s near-term outlook.

#fxopen #forex #forexanalysis

Disclaimer: This analysis represents my own opinion only. It is not to be construed as an opinion, offer, solicitation, recommendation, or financial advice of the Companies operating under the FXOpen brand.
 
Back
Top Bottom