
• Attention Forex Brokers, FX Companies & Hedge Funds.

    forum.forex is available for Acquisition: £89,000 GBP

    Contact Us

Daily Market Analytics - Forex

EURUSD Technical Analysis – 11 Aug, 2026
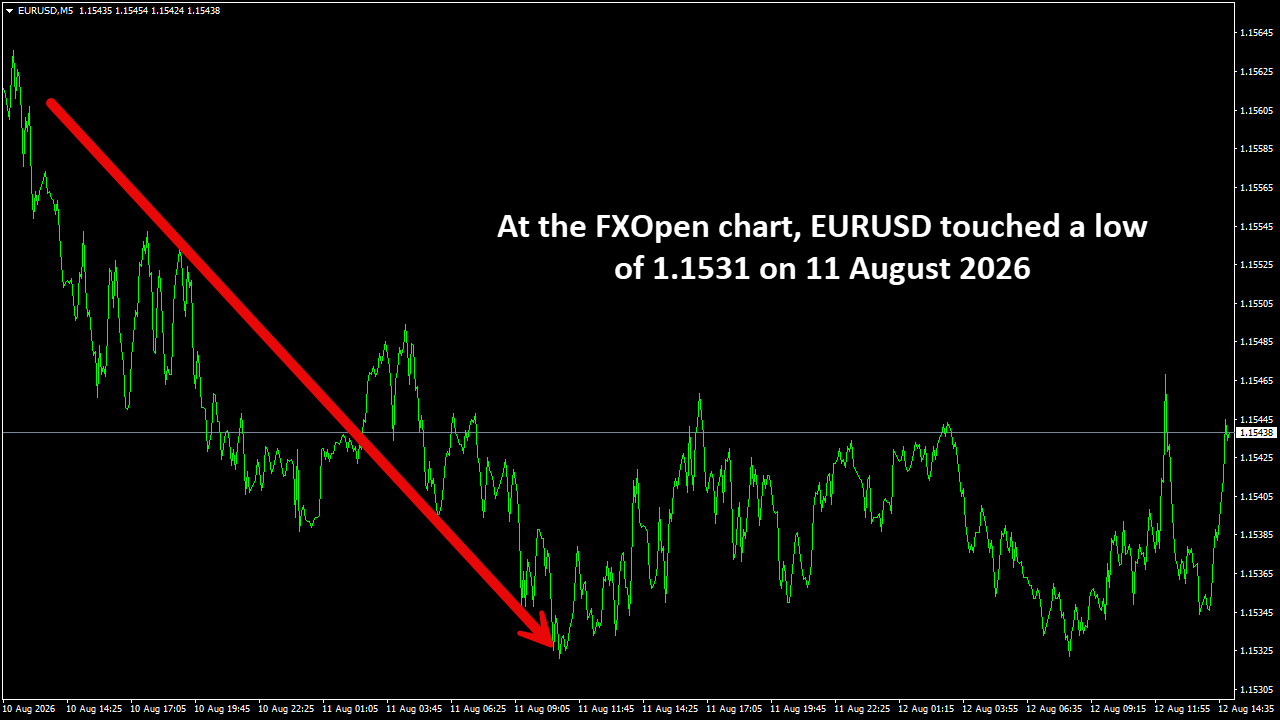
EURUSD – At the FXOpen chart, EURUSD touched a low of 1.1531 on 11 August 2026
EURUSDM5.png


At the FXOpen chart, EURUSD touched a low of 1.1531 on 11 August 2026, signalling renewed bearish momentum after failing to sustain gains above 1.1600. The decline reflects dollar strength amid firm U.S. yields, while euro sentiment remains pressured by sluggish growth data. Technically, the low coincides with the 200-day moving average, a critical support zone that has historically attracted buying interest. Momentum indicators show bearish bias, with RSI trending lower but not yet oversold, suggesting room for further downside. A decisive break below 1.1530 could expose 1.1500, while recovery above 1.1580 would ease immediate selling pressure.

#fxopen #forex #forexanalysis

Disclaimer: This analysis represents my own opinion only. It is not to be construed as an opinion, offer, solicitation, recommendation, or financial advice of the Companies operating under the FXOpen brand.
 
GBPJPY Technical Analysis – 11 Aug, 2026
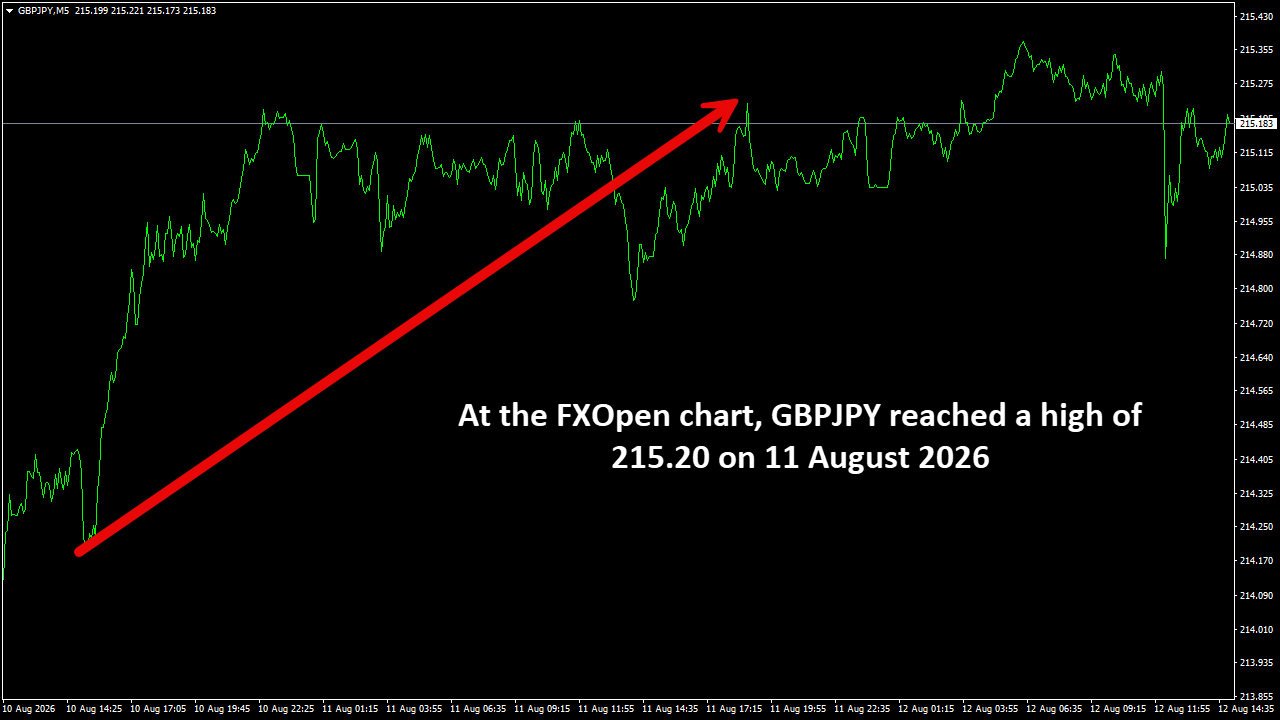
GBPJPY – At the FXOpen chart, GBPJPY reached a high of 215.20 on 11 August 2026

GBPJPYM5.png


At the FXOpen chart, GBPJPY reached a high of 215.20 on 11 August 2026, extending its bullish trajectory fuelled by persistent yen weakness and sterling resilience. The move underscores strong upward momentum, with price action firmly supported by the 20-day moving average, which continues to slope higher. The high coincides with a psychological resistance zone, where profit-taking could emerge, yet technical indicators remain constructive. RSI readings hover near overbought levels, suggesting potential short-term consolidation, but the broader trend favours continuation. Holding above 213.50 as support keeps the bias intact, with scope for further gains toward 216.50 if momentum persists.

#fxopen #forex #forexanalysis

Disclaimer: This analysis represents my own opinion only. It is not to be construed as an opinion, offer, solicitation, recommendation, or financial advice of the Companies operating under the FXOpen brand.
 
Last edited:
GBPUSD Technical Analysis – 11 Aug, 2026
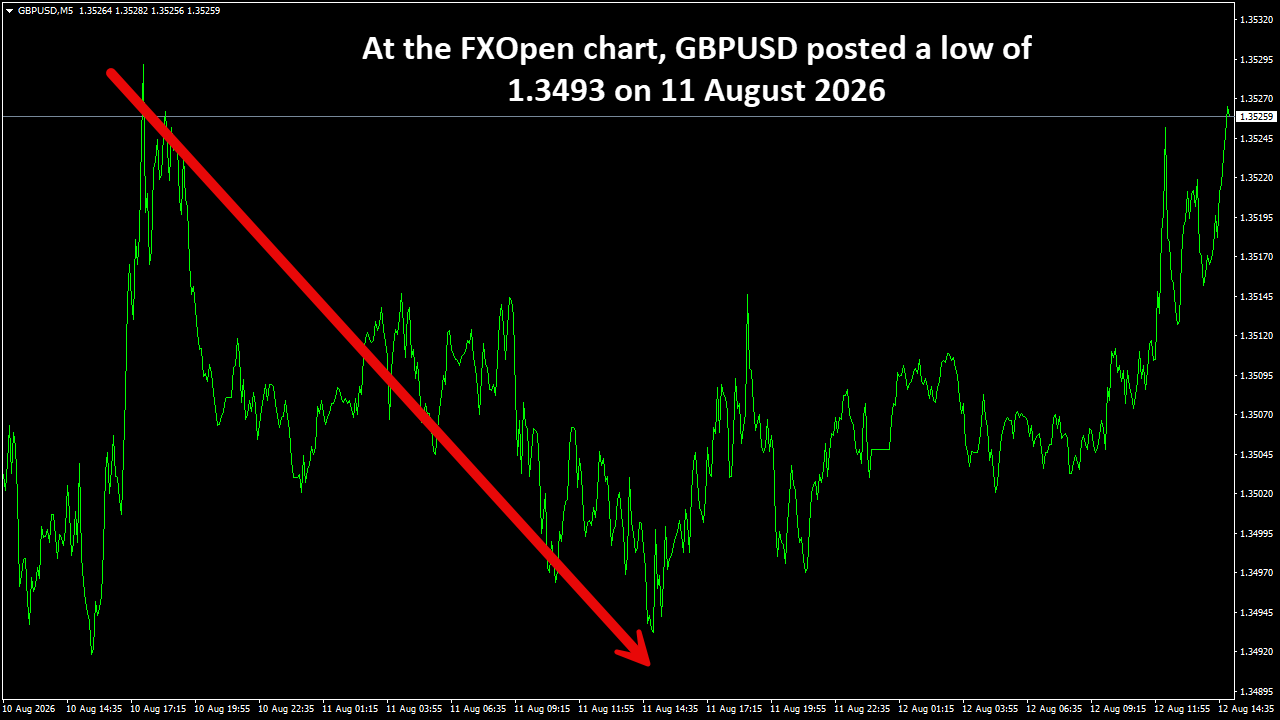
GBPUSD – At the FXOpen chart, GBPUSD posted a low of 1.3493 on 11 August 2026

GBPUSDM5.png


At the FXOpen chart, GBPUSD posted a low of 1.3493 on 11 August 2026, reflecting sustained bearish sentiment as the dollar extended its dominance. The decline underscores sterling’s vulnerability amid weaker UK economic data and cautious market outlook. Technically, the low coincides with a critical support zone near the 1.3500 psychological level, which has historically acted as a pivot. Momentum indicators remain bearish, with RSI trending lower but not yet oversold, suggesting potential continuation. A decisive break below 1.3490 could expose 1.3450, while recovery above 1.3540 would be required to shift bias back toward stabilization.

#fxopen #forex #forexanalysis

Disclaimer: This analysis represents my own opinion only. It is not to be construed as an opinion, offer, solicitation, recommendation, or financial advice of the Companies operating under the FXOpen brand.
 
NZDUSD Technical Analysis – 11 Aug, 2026
NZDUSD – At the FXOpen chart, NZDUSD registered a low of 0.5868 on 11 August 2026

NZDUSDM5.png


At the FXOpen chart, NZDUSD registered a low of 0.5868 on 11 August 2026, reflecting persistent weakness in the kiwi amid strong U.S. dollar demand. The decline underscores the pair’s vulnerability as global risk sentiment remains fragile, weighing on commodity-linked currencies. Technically, the low aligns with a key support zone near 0.5870, which has previously acted as a pivot in downside moves. Momentum indicators remain bearish, with RSI trending lower but not yet oversold, suggesting scope for further weakness. A break below 0.5865 could expose 0.5820, while recovery above 0.5910 would be needed to stabilize near-term sentiment.

#fxopen #forex #forexanalysis

Disclaimer: This analysis represents my own opinion only. It is not to be construed as an opinion, offer, solicitation, recommendation, or financial advice of the Companies operating under the FXOpen brand.
 
USDCAD Technical Analysis – 11 Aug, 2026
USDCAD – At the FXOpen chart, USDCAD recorded a low of 1.3916 on 11 August 2026

USDCADM5.png


At the FXOpen chart, USDCAD recorded a low of 1.3916 on 11 August 2026, reflecting a corrective pullback within its broader bullish structure. The decline highlights temporary Canadian dollar strength, supported by firm commodity prices, yet the overall trend remains dollar-dominated. Technically, the low coincides with the 50-day moving average, acting as dynamic support and maintaining the pair’s upward bias. Momentum indicators show easing bullish pressure, with RSI drifting toward neutral levels, suggesting consolidation rather than reversal. Holding above 1.3900 keeps the structure intact, while recovery above 1.3960 would reinforce bullish momentum toward the 1.4000 psychological threshold.

#fxopen #forex #forexanalysis

Disclaimer: This analysis represents my own opinion only. It is not to be construed as an opinion, offer, solicitation, recommendation, or financial advice of the Companies operating under the FXOpen brand.
 
USDCHF Technical Analysis – 11 Aug, 2026
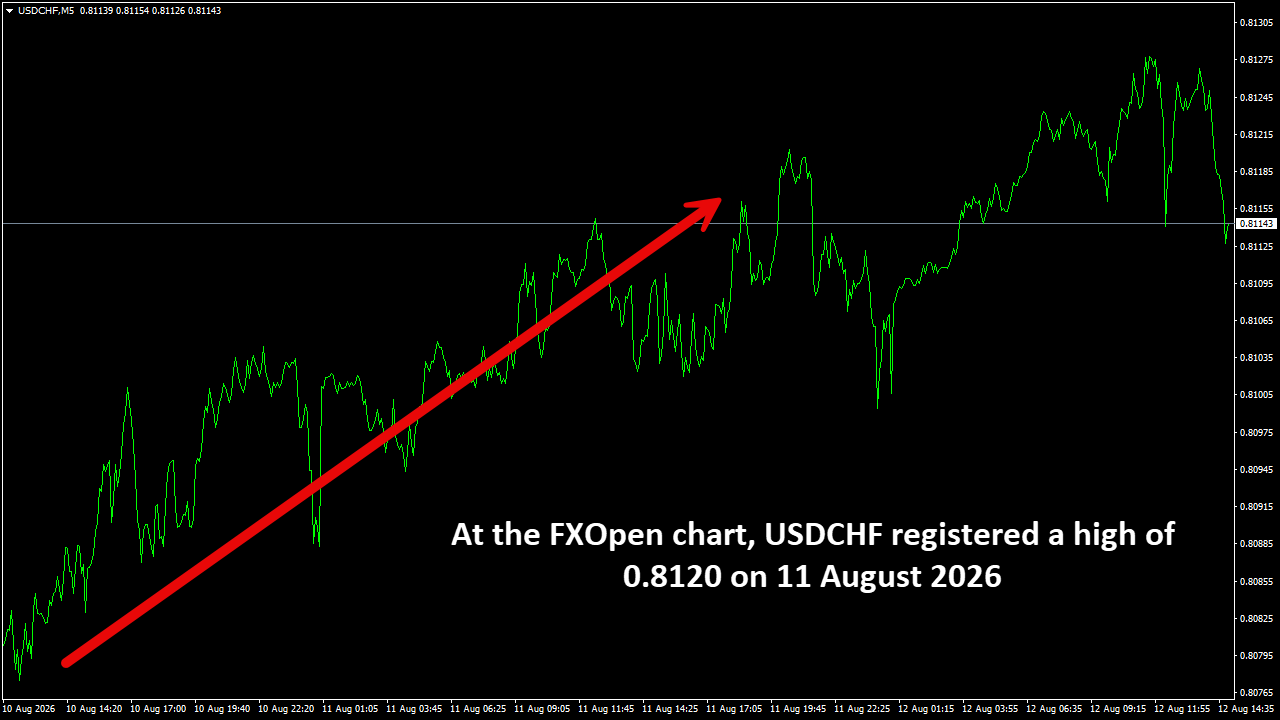
USDCHF – At the FXOpen chart, USDCHF registered a high of 0.8120 on 11 August 2026

USDCHFM5.png


At the FXOpen chart, USDCHF registered a high of 0.8120 on 11 August 2026, reflecting a notable rebound in dollar strength against the franc. The move underscores renewed safe-haven demand for the dollar, while the franc’s defensive appeal has softened amid stabilizing European risk sentiment. Technically, the high coincides with the upper boundary of a short-term ascending channel, reinforcing bullish momentum. RSI readings approach overbought territory, suggesting potential consolidation, yet price action remains constructive. Holding above 0.8080 as support keeps the bias intact, with scope for further gains toward 0.8150 if buyers maintain control.

#fxopen #forex #forexanalysis

Disclaimer: This analysis represents my own opinion only. It is not to be construed as an opinion, offer, solicitation, recommendation, or financial advice of the Companies operating under the FXOpen brand.
 
USDJPY Technical Analysis – 11 Aug, 2026
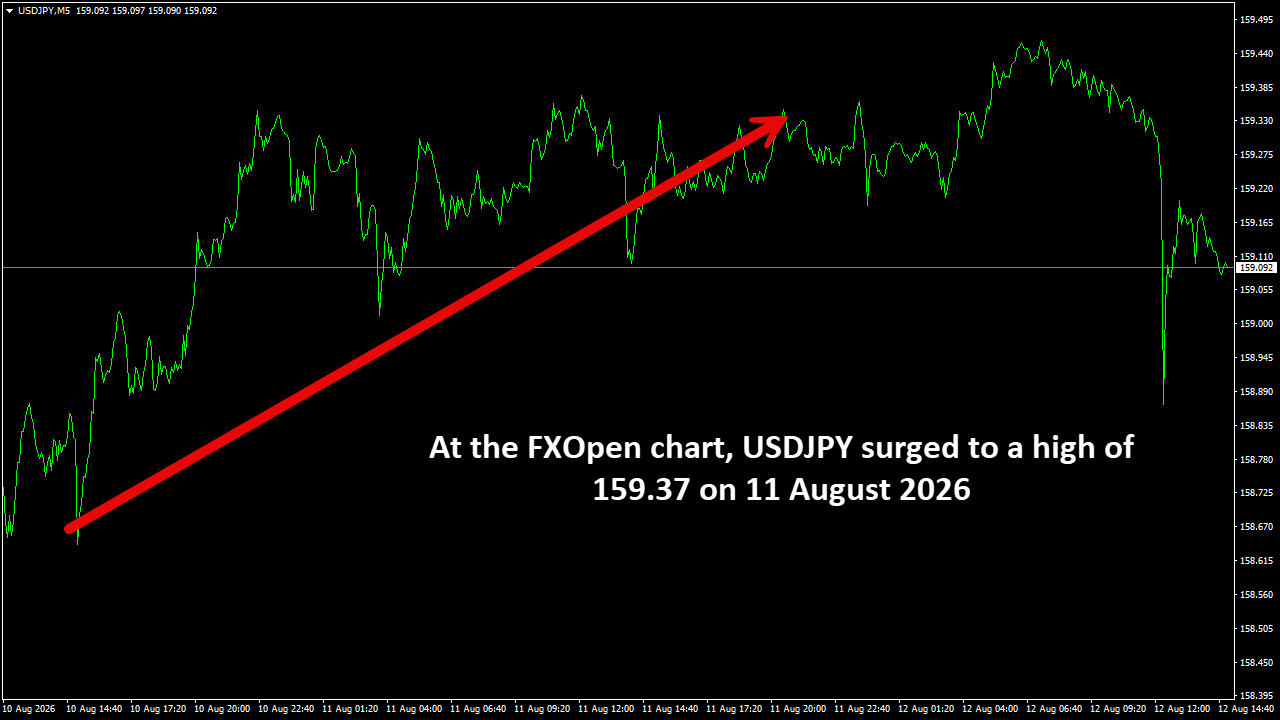
USDJPY - At the FXOpen chart, USDJPY surged to a high of 159.37 on 11 August 2026

USDJPYM5.png


At the FXOpen chart, USDJPY surged to a high of 159.37 on 11 August 2026, underscoring the pair’s entrenched bullish momentum amid persistent yen weakness. The move reflects widening yield differentials, with U.S. rates remaining elevated while the Bank of Japan sustains its accommodative stance. Technically, the high coincides with the upper boundary of a rising channel, reinforcing the strength of the ongoing uptrend. RSI readings remain firmly in overbought territory, suggesting potential short-term consolidation, yet no clear reversal signals are evident. Holding above 158.50 as support keeps the bias constructive, with scope for further gains toward 160.00.

#fxopen #forex #forexanalysis

Disclaimer: This analysis represents my own opinion only. It is not to be construed as an opinion, offer, solicitation, recommendation, or financial advice of the Companies operating under the FXOpen brand.
 
AUDUSD Technical Analysis – 21 Aug, 2026
AUDUSD – At the FXOpen chart, the M5 timeframe reveals an aggressive bullish continuation leg initiating from the 0.7135 base up to the 0.7180 peak

AUDUSDM30.png


AUDUSD – High: 0.7180 | Low: 0.7135 – Date 21 Aug 2026
At the FXOpen chart, the M5 timeframe reveals an aggressive bullish continuation leg initiating from the 0.7135 base up to the 0.7180 peak. Price action engineered a clean succession of higher swing lows across the session, with the rising 20-period EMA acting as continuous dynamic support. Momentum oscillators moved into overbought territory before transitioning into horizontal consolidation above 0.7160. Active institutional accumulation is evident around the 0.7145 liquidity pocket. A sustained breakout above 0.7180 unlocks further expansion toward 0.7200, whereas losing 0.7135 invalidates the immediate intraday bias and exposes the 0.7100 demand zone.

#fxopen #forex #forexanalysis

Disclaimer: This analysis represents my own opinion only. It is not to be construed as an opinion, offer, solicitation, recommendation, or financial advice of the Companies operating under the FXOpen brand.
 
EURCHF Technical Analysis – 21 Aug, 2026
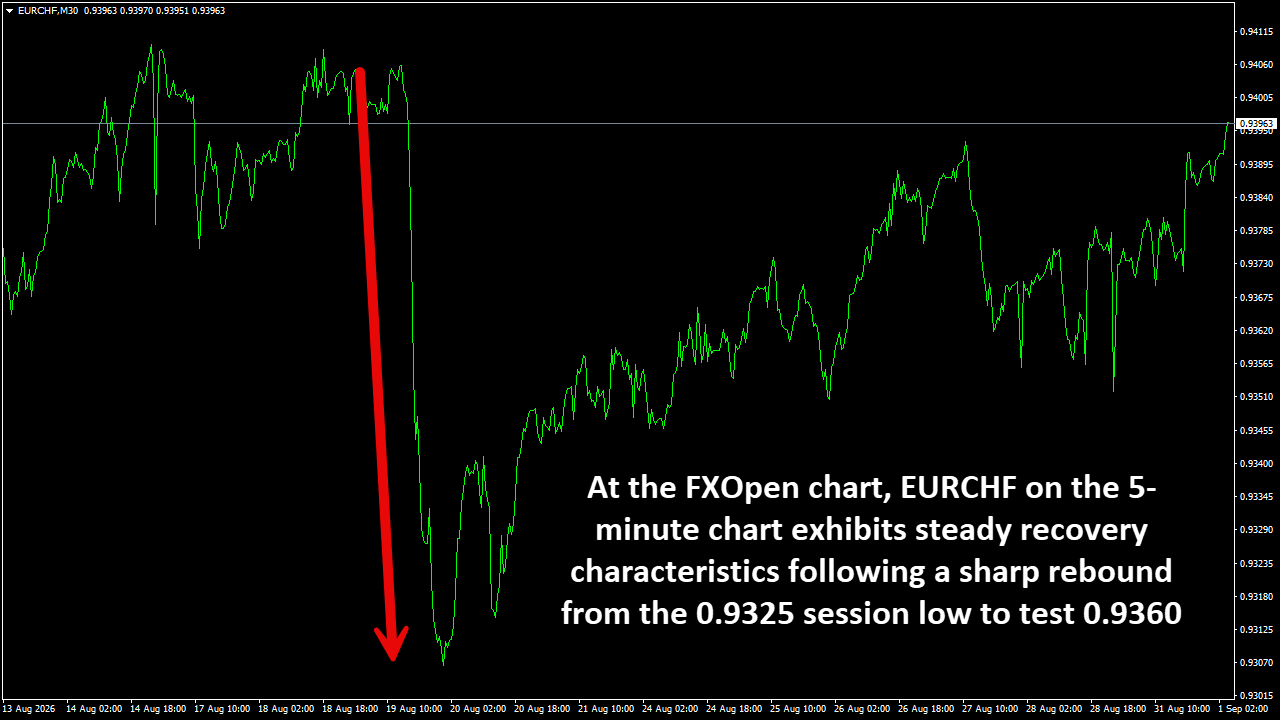
EURCHF – At the FXOpen chart, EURCHF on the 5-minute chart exhibits steady recovery characteristics following a sharp rebound from the 0.9325 session low to test 0.9360

EURCHFM30.png


EURCHF – High: 0.9360 | Low: 0.9325 – Date 21 Aug 2026
At the FXOpen chart, EURCHF on the 5-minute chart exhibits steady recovery characteristics following a sharp rebound from the 0.9325 session low to test 0.9360. Price action formed an ascending micro-channel, supported dynamically by the 50-period moving average near 0.9340. The MACD histogram displays gradual bullish divergence as dip-buyers absorb selling pressure above the recent trough. A confirmed M5 breakout above 0.9360 opens room for an extended relief rally toward 0.9385, while a breakdown below the 0.9325 support shelf signals resumption of the broader downtrend toward 0.9300.

#fxopen #forex #forexanalysis

Disclaimer: This analysis represents my own opinion only. It is not to be construed as an opinion, offer, solicitation, recommendation, or financial advice of the Companies operating under the FXOpen brand.
 
EURJPY Technical Analysis – 21 Aug, 2026
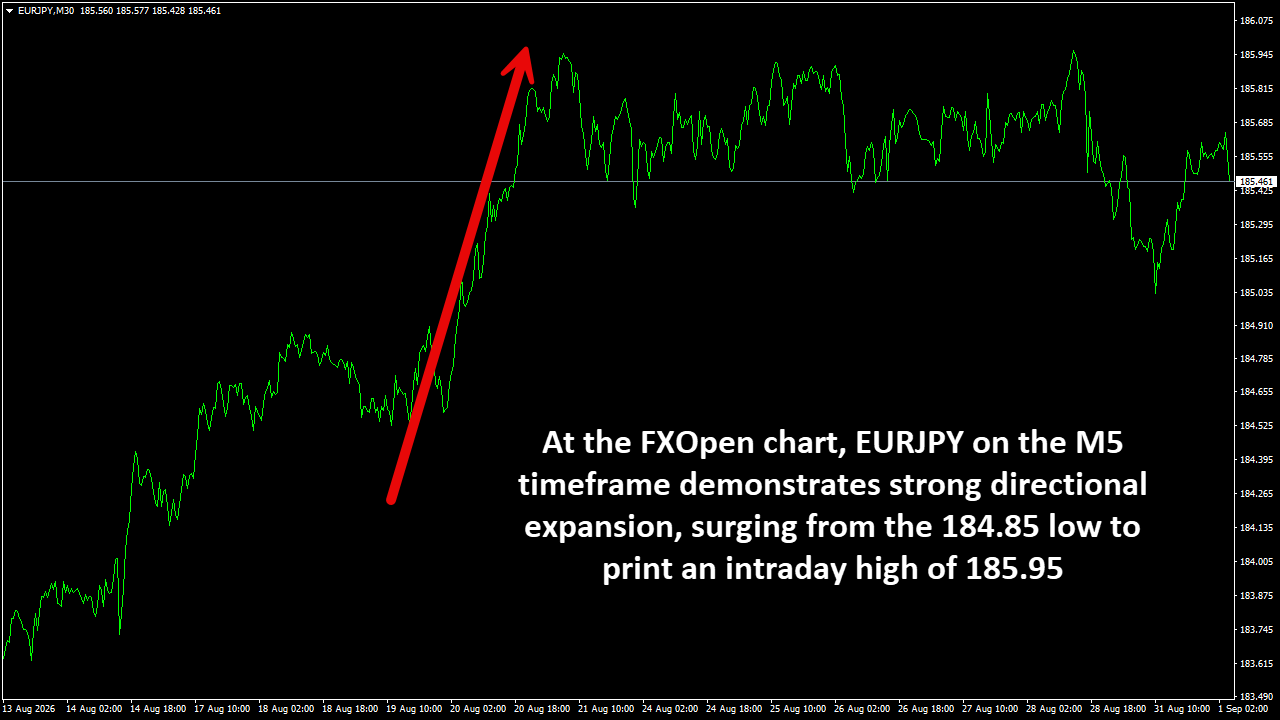
EURJPY – At the FXOpen chart, EURJPY on the M5 timeframe demonstrates strong directional expansion, surging from the 184.85 low to print an intraday high of 185.95

EURJPYM30.png


EURJPY – High: 185.95 | Low: 184.85 – Date 21 Aug 2026
At the FXOpen chart, EURJPY on the M5 timeframe demonstrates strong directional expansion, surging from the 184.85 low to print an intraday high of 185.95. The 5-minute order flow confirms aggressive institutional buying, creating substantial volume imbalances above the 185.20 level. Price action is coiling into a tight bull flag below 185.90, allowing the RSI to normalize toward 55. Sustained trading above 185.50 preserves the bullish market structure toward the 186.40 target, whereas an M5 close below 184.85 risks triggering an intraday corrective swing toward 184.20.

#fxopen #forex #forexanalysis

Disclaimer: This analysis represents my own opinion only. It is not to be construed as an opinion, offer, solicitation, recommendation, or financial advice of the Companies operating under the FXOpen brand.
 
EURUSD Technical Analysis – 21 Aug, 2026
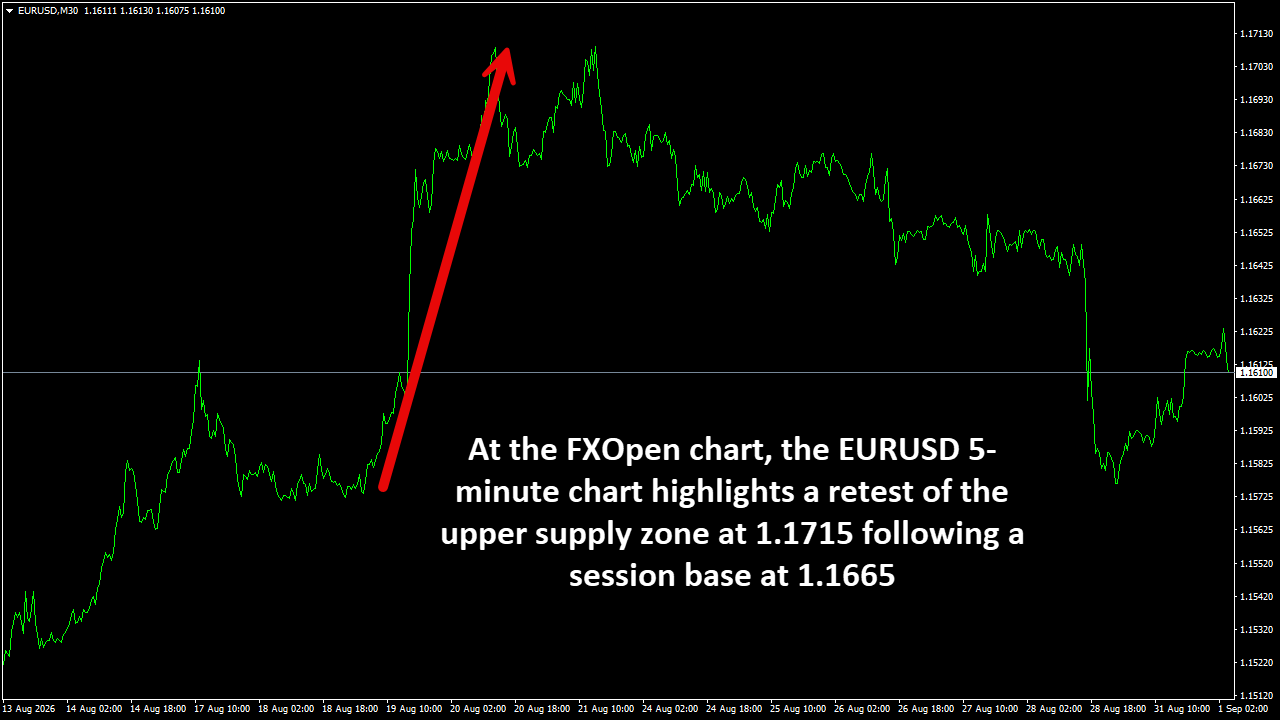
EURUSD – At the FXOpen chart, the EURUSD 5-minute chart highlights a retest of the upper supply zone at 1.1715 following a session base at 1.1665

EURUSDM30.png


EURUSD – High: 1.1715 | Low: 1.1665 – Date 21 Aug 2026
At the FXOpen chart, the EURUSD 5-minute chart highlights a retest of the upper supply zone at 1.1715 following a session base at 1.1665. The market established a double-top structure near 1.1715 before entering a controlled pullback toward the 1.1680 support shelf. The 20-period and 50-period EMAs remain in a constructive alignment, providing underlying support. A technical clearance above 1.1715 paves the way for fresh multi-month highs near 1.1750, whereas a decisive break below 1.1665 confirms an intraday trend reversal targeting 1.1620.

#fxopen #forex #forexanalysis

Disclaimer: This analysis represents my own opinion only. It is not to be construed as an opinion, offer, solicitation, recommendation, or financial advice of the Companies operating under the FXOpen brand.
 
Back
Top Bottom