• Attention Forex Brokers, FX Companies & Hedge Funds.

    forum.forex is available for Acquisition

    Enquire

Silver Daily Analysis

FXGlory Ltd

Well-known member
SILVER analysis for 13.10.2023


Silver-FXGlory.jpg


On the 4h chart for Silver, the Parabolic SAR has marked three consecutive points above the price, hinting at a potential downtrend. The MACD confirms this bearish sentiment, with its line at 0.091 crossing below the signal line at 0.125. The Histogram further corroborates this with a drop to -0.034. Silver's current price, sitting at 21.875, is proximate to the Fibonacci retracement level of 0.618 priced at 21.829. The next resistance is spotted at the FIB 0.5 level, 22.193, followed by the FIB 0.382 at 22.557. On the support side, FIB 0.786 is at 21.311, and notably, FIB 1 is positioned at 20.652. This amalgamation of indicators suggests a bearish undertone in the short-term movement for Silver.


FXGlory
13.10.2023


FXGLORY.gif
 
Silver Market Analysis for 20.12.2023

1703044914090.jpeg


Time Zone: GMT +2
Time Frame: 4 Hours (H4)


Fundamental Analysis:


The silver market, much like its counterpart gold, is heavily influenced by a host of macroeconomic factors, including industrial demand, inflation rates, and the performance of major currencies. It's also sensitive to geopolitical tensions and economic policies that can sway investor sentiment towards safe-haven assets like precious metals.


Price Action:

The H4 chart for silver indicates a period of volatility with a recent uptick in prices, as evidenced by the green candlesticks surpassing the moving averages. However, the latest candles show a slight bearish retracement, which could signal a consolidation phase or a potential downturn in the market.


Key Technical Indicators:

Moving Averages:
A crossover is observed with the short-term moving average dipping below the longer-term moving average, typically a bearish signal, suggesting that the price may be entering a corrective phase.


MACD (Moving Average Convergence Divergence): The MACD line is above the signal line but showing signs of convergence, which could indicate slowing bullish momentum. The histogram reflects this with diminishing bullish bars.


Volume: There's been a noticeable decline in volume alongside the price retracement, which could imply a lack of conviction in the bearish movement, suggesting that the uptrend may still have some underlying strength.


Support and Resistance:

Support
: The nearest support level is located at around 23.40000.

Resistance: The previous peak forms a resistance level, placed at around 25.572970


Conclusion and Consideration:

While the silver market shows a potential short-term bearish signal through the MA crossover, the MACD and volume indicators suggest that the bullish trend may not be over. Traders should watch for whether the price can maintain above the support level or if it will break below, indicating a stronger bearish correction. Upcoming economic data and market news should be monitored to gauge potential shifts in sentiment. As always, employing prudent risk management strategies in this volatile market is advisable.


Disclaimer: This analysis is for informational purposes only and does not constitute investment advice. Trading in the silver market carries risks and may result in loss of capital. Investors should perform their own due diligence and consult with a financial advisor before engaging in any trading activities.

FXGlory
20.12.2023


1703044941668.gif
 
SILVER analysis for 15.01.2023


SILVERH4.jpg


Time Zone: GMT +2
Time Frame: 4 Hours (H4)


Fundamental Analysis:

Silver, represented as XAGUSD in forex markets, is influenced by a multitude of factors, including industrial demand, investment demand, and macroeconomic trends. Fundamentally, silver's dual status as both an industrial metal and a precious metal means its price is affected by both industrial production levels and investor sentiment. Economic data releases, such as manufacturing indices and inflation rates, alongside geopolitical events, can sway silver prices significantly. Additionally, as silver is priced in U.S. dollars, fluctuations in the strength of the dollar have a reciprocal effect on silver's value.


Price Action:
The H4 timeframe for XAGUSD shows that the price has recently rebounded after a downtrend, suggesting a potential shift in momentum. The recent candles have closed higher than previous ones, indicating a short-term bullish sentiment among traders. This recovery in price may attract more buyers if it sustains, leading to a further increase in silver prices.


Technical Indicators:
RSI (Relative Strength Index):
The RSI is hovering around 55, suggesting that the market is neither overbought nor oversold, and there is room for price movement in either direction without immediate pressure from momentum traders.

MACD (Moving Average Convergence Divergence): The MACD line is below the signal line but appears to be converging, indicating that the bearish momentum may be waning. If the MACD crosses above the signal line, it could be a bullish signal.

Ichimoku Cloud: The price is currently below the Ichimoku cloud, which typically suggests a bearish sentiment. However, the recent price action towards the cloud may indicate a potential trend reversal if the price breaks through the cloud.

Parabolic SAR: The last four dots of the Parabolic SAR are below the candlesticks, signaling a potential bullish trend reversal or strengthening of the current uptrend.


Support and Resistance Levels:
Support:
The recent low around the $22.58 mark could serve as a short-term support level.

Resistance: A previous area of consolidation around the $23.40 level may act as a resistance in the near term.


Conclusion and Consideration:
The technical indicators on the H4 chart for XAGUSD suggest a possible shift in momentum, with several signs pointing towards a budding bullish sentiment. Traders should watch for a potential bullish breakout if the price continues to rise and breaches the Ichimoku cloud. Caution is advised as the market has not yet fully confirmed a trend reversal; thus, keeping an eye on both fundamental factors affecting silver and the key technical levels identified is essential for risk management. Setting stop losses below the support level and considering taking profits near resistance can help mitigate risks associated with potential volatility.


Disclaimer: The above analysis is for educational purposes and should not be taken as investment advice. Traders should conduct their own research and risk assessment before making any trading decisions.


FXGlory
15.01.2024


FXGLORY.gif
 
SILVER analysis for 09.02.2024


SILVERH4.jpg


Time Zone: GMT +2
Time Frame: 4 Hours (H4)


Fundamental Analysis:

Silver is traded against the US Dollar in the SILVER/USD pair. Fundamental factors affecting silver include industrial demand, mine production levels, and macroeconomic indicators that influence the US Dollar such as interest rates and inflation data. Investor sentiment can also be swayed by geopolitical events and trends in other commodity markets, particularly precious metals. Given that silver has applications in various industrial sectors, technological innovations and market demand in these areas can significantly impact its price.


Price Action:
The H4 timeframe for SILVER/USD shows a recent uptrend with the price moving above key moving averages. The market has been recovering from a dip, making higher highs and higher lows, indicating a reversal from the previous downtrend. The price is currently testing a significant resistance level.


Key Technical Indicators:
Parabolic SAR:
The last dot of the Parabolic SAR has flipped below the price candles, signaling a potential trend reversal to the upside.
RSI (Relative Strength Index): The RSI is hovering around 58, which is moderately bullish and suggests that there may still be room for upward price movement before reaching overbought conditions.
MACD (Moving Average Convergence Divergence): The MACD histogram is positive, with the MACD line above the signal line, indicating bullish momentum.
Bollinger Bands: The price is oscillating towards the upper Bollinger Band, which often acts as a dynamic resistance level.


Support and Resistance:
Support:
The 38.2% Fibonacci retracement level serves as the nearest support, followed by the lower Bollinger Band.
Resistance: The 50% Fibonacci level is the immediate resistance, with further potential resistance near the 61.8% retracement and the upper Bollinger Band.


Conclusion and Consideration:
The SILVER/USD pair on the H4 chart exhibits signs of a bullish reversal, supported by the positive crossover in the MACD and the Parabolic SAR signal. The RSI indicates that buyers are in control but not yet overextended. Traders should watch for a breakout above the 50% Fibonacci level for confirmation of continued bullish momentum. It's important to monitor fundamental factors such as economic data releases and industrial demand for silver, which could affect the trend. As the market approaches key resistance levels, setting appropriate risk management measures like stop losses is advisable, especially in the volatile commodities market.


Disclaimer: The provided analysis is for informational purposes only and does not constitute investment advice. Traders should conduct their own research and analysis before making any trading decisions.


FxGlory
09.02.2024


FXGLORY.gif
 
SILVER analysis for 23.04.2024


SILVERH4-Daily-Analysis-on-23.04.jpg


Time Zone: GMT +2
Time Frame: 4 Hours (H4)


Fundamental Analysis:

Silver, as depicted by the SILVER/USD currency pair, is influenced by a spectrum of fundamental factors including industrial consumption, mining output, and economic indicators that drive the US Dollar, like interest rates and inflation figures. Silver's dual nature as an industrial metal and a monetary instrument means its demand could be shaped by technological advancements and economic trends. The metal's price is also sensitive to global political climate shifts and its correlation with other commodities, especially within the precious metals sector.


Price Action:
The H4 chart reveals that silver has been undergoing a strong bearish trend, evidenced by a consistent series of lower lows and lower highs. The recent price movement has breached past the lower Bollinger Band, indicating a strong downward push. However, this could also signify potential overselling, warranting caution for any continuation of the trend.


Key Technical Indicators:
Bollinger Bands:
Price has broken below the lower Bollinger Band, suggesting an extension of the bearish move or a potential retracement if it is an oversold situation.
MACD: The MACD line remains below the signal line and continues to diverge negatively, which supports the bearish momentum observed in the price action.
RSI: The RSI is firmly in the oversold territory, signaling a significant bearish strength that might lead to a possible reversal if buyers step in.


Support and Resistance Levels:
Support
: Immediate support is found at the recent low of the price action, with further support potentially near the 27.05 mark.
Resistance: The previous low around the 26.75 level may now act as resistance, with additional resistance likely at the midline of the Bollinger Bands.


Conclusion and Considerations:
In summary, SILVERUSD is exhibiting strong bearish momentum as indicated by the technical indicators and recent price action. While the oversold RSI suggests a potential pullback, the prevailing downward trend could persist if the bearish sentiment continues. Traders should consider the impact of macroeconomic factors and market sentiment on silver prices and employ prudent risk management strategies. Monitoring for any signs of a reversal or stabilization around key support levels would be crucial for traders looking to enter positions.


Disclaimer: This analysis is intended for informational purposes only and should not be construed as financial advice. It is important for individuals to perform their own due diligence before engaging in trading activities.


FxGlory
23.04.2024


FXGLORY.gif
 
Platinum analysis for 24.04.2024


PlatinumH4.jpg


Time Zone: GMT +2
Time Frame: 4 Hours (H4)


Fundamental Analysis:

Platinum's price is largely influenced by supply-demand dynamics, industrial usage, especially in automotive catalytic converters, and investment demand. It's important to consider the industrial health and economic indicators such as automobile sales, manufacturing data, and investment trends which can drive platinum prices. Additionally, mining supply disruptions or changes in recycling volumes can impact the market significantly.


Price Action:
The platinum market on the H4 chart has been experiencing a downtrend, evidenced by the formation of lower highs and lower lows. Recently, there seems to be a slight bullish retracement, as the price has moved up from its latest low. This could suggest a temporary slowing down of the downward trend, possibly presenting a short-term buying opportunity.


Key Technical Indicators:

Bollinger Bands
: Platinum's price is hovering around the lower Bollinger Band, which usually indicates an oversold condition or a strong downtrend. A push back towards the middle band could signal a temporary reversal or consolidation.

RSI (Relative Strength Index): The RSI is below the 50-level, indicating bearish momentum. However, it is not in the oversold territory, leaving room for further downward movement or a potential reversal if the market sentiment shifts.

MACD (Moving Average Convergence Divergence): The MACD line is below the signal line and the histogram shows an increase in negative momentum, reinforcing the current bearish trend.


Support and Resistance:

Support
: The most recent low acts as the immediate support level. Should the price break below this level, it may find further support near previous lows not visible on the current chart frame.

Resistance: Immediate resistance may be encountered at the level where the retracement began. A more significant resistance level would be where the price intersects with the middle Bollinger Band.


Conclusion and Consideration:
The current technical outlook for platinum on the H4 chart suggests a continuation of the bearish trend with a minor retracement in the short term. Traders should monitor the RSI for signs of a reversal and the MACD for changes in momentum. It is crucial to keep abreast of industrial and economic developments that could affect platinum prices. Risk management remains essential due to the inherent volatility in the commodities market.


Disclaimer: The provided analysis is for informational purposes only and does not constitute investment advice. Traders should conduct their own research and analysis before making any trading decisions.


FxGlory
24.04.2024


image_2024-02-15_07_28_16.gif
 
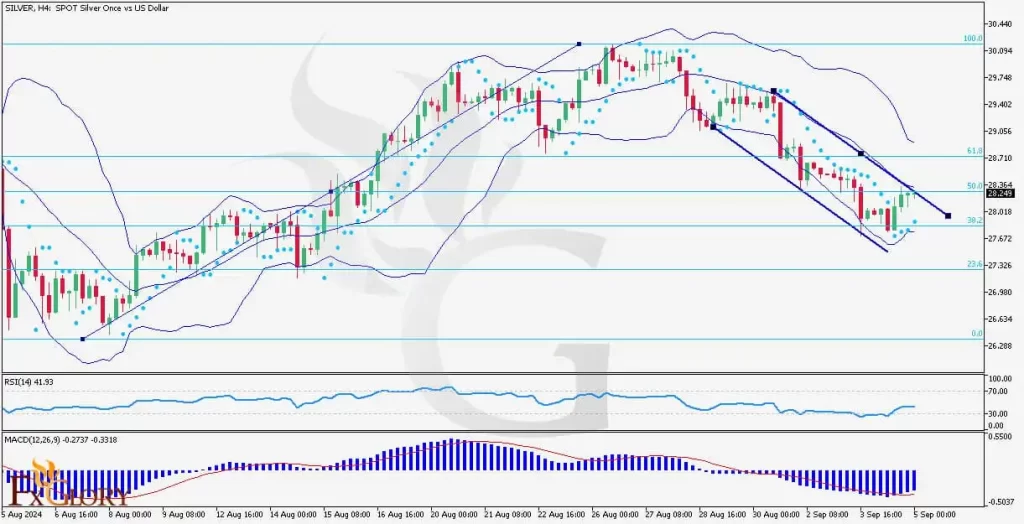
Silver/USD (XAGUSD) H4 Technical and Fundamental Analysis for 09.05.2024


SILVER-H4-Technical-And-Fundamental-Analysis-On-09.05.2024--1024x524.webp


Time Zone: GMT +3
Time Frame: 4 Hours (H4)


Fundamental Analysis:

As of the latest market insights, Silver trading against the US Dollar (XAGUSD) on the H4 timeframe shows nuanced movements ahead of significant economic data releases. Today, US economic indicators such as job cut announcements, ADP employment change, and initial jobless claims could sway the USD strength significantly. Favorable reports are expected to bolster the USD, exerting downward pressure on Silver prices. Conversely, weaker data may enhance Silver's appeal as a hedge, pushing prices upward. Investors and traders should remain vigilant to these updates to gauge potential market directions effectively.


Price Action:
On the H4 chart, Silver has been navigating a challenging terrain marked by a descending channel, showcasing a bearish trend that recently attempted a reversal. The Silver USD price action near the middle Bollinger Band indicates a struggle between bears and bulls, with recent candles attempting to break above this resistance. The near-touch of the Fibonacci 50% retracement level suggests a potential shift in momentum if sustained buying pressure continues, pointing to an upcoming test of higher resistance levels.


Key Technical Indicators:
Bollinger Bands:
The Silver price has been predominantly in the lower half of the bands but recently rebounded from the lower band towards the middle. This movement indicates a possible alleviation of the selling pressure, with the current Silver price attempting to breach the middle band—a crucial pivot for further bullish signals.
Parabolic SAR: Recent dots positioned below the candles signify a potential reversal from the prior downtrend. This indicator suggests that the downtrend momentum is losing strength, and a bullish sentiment might be developing, especially as the price approaches the middle Bollinger Band and the Fib 50% level.

RSI (Relative Strength Index): With a reading of 41.93, the RSI indicates that the market is neither oversold nor overbought, leaving room for potential upward movement if buying pressure increases.
MACD (Moving Average Convergence Divergence): The MACD line remains below the signal line, indicating ongoing bearish momentum. However, the decreasing histogram bars may suggest that the bearish momentum is weakening, aligning with the potential shift suggested by other indicators.


Support and Resistance Levels:
Support Levels:
Immediate support is found at the 23.6% Fibonacci retracement level, around $27.322, where previous lows have consolidated.
Resistance Levels: Initial resistance is observed at the 38.2% Fibonacci level, near $28.018. A breach above this could test the 50% level at approximately $28.710, which aligns with the middle Bollinger Band.


Conclusion and Consideration:
The Silver/ XAGUSD market on the H4 chart presents a complex scenario, balancing between bearish trends and emerging bullish signals. The approaching economic data from the US could serve as a catalyst for significant price movements. Traders should monitor these indicators closely, considering both the technical setups and external economic factors influencing market dynamics.


Disclaimer: This Silver USD analysis is provided for informational purposes only and does not constitute investment advice. Investors should conduct their due diligence and consider their financial position before engaging in trades based on this analysis.


FXGlory
09.05.2024


FXGLORY.gif
 
Back
Top Bottom