SILVERUSD Daily Technical and Fundamental Analysis for 01.30.2025
Time Zone: GMT +2
Time Frame: 4 Hours (H4)
Fundamental Analysis
Silver (XAG/USD) remains a key asset in the commodities market, influenced by economic data, geopolitical risks, and inflationary trends. Today, the US economic calendar includes GDP growth figures, jobless claims, and inflation reports, which will play a significant role in shaping USD strength and, consequently, silver prices. Strong GDP data could boost the dollar, leading to downward pressure on silver, while weak figures may drive silver prices higher as investors seek safe-haven assets. Additionally, the pending home sales report and natural gas inventory data may impact overall market sentiment, influencing silver demand. Given the Federal Reserve’s upcoming policy decisions, traders are closely watching for clues on future interest rate adjustments, which could affect the opportunity cost of holding non-yielding assets like silver.
Price Action
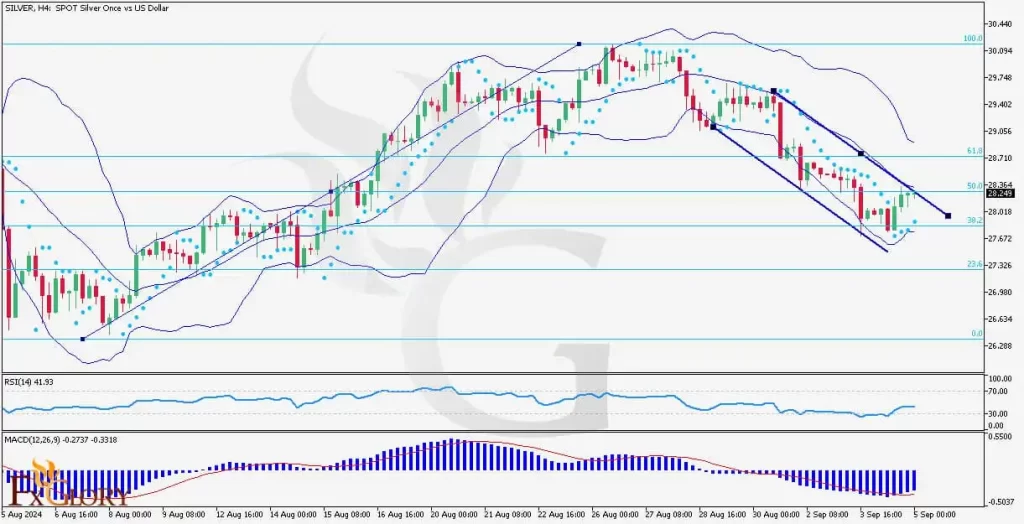
Silver’s H4 chart analysis suggests that the price action has been bullish in recent sessions. The price recently broke above the Ichimoku cloud, indicating a shift in momentum. However, it has reached the 0% Fibonacci retracement level, which has acted as a strong resistance zone multiple times this month. If silver fails to break and sustain above this level, a retracement towards 30.50 or 30.17 is possible. Conversely, a confirmed breakout above resistance could lead to a continuation towards 31.00 and beyond. The current candles indicate strong bullish pressure, but overbought conditions in momentum indicators suggest a possible correction before further upside.
Key Technical Indicators
Ichimoku Cloud: The price has broken above the Ichimoku cloud, signaling a potential bullish continuation. The green cloud below the price suggests a supportive trend, while the 0% Fibonacci level remains a key resistance. If silver fails to break higher, a pullback towards the cloud’s upper boundary could occur before another attempt to rally.
Adaptive Moving Average (Period 9, Fast EMA 2, Slow EMA 30): Silver’s candles have crossed above the moving average line, indicating strong bullish momentum. The price action remains above the EMA 30, suggesting that the short-term trend remains positive. As long as silver stays above this moving average, the bullish outlook remains intact.
RSI (Relative Strength Index 14): The RSI is currently at 62.33, indicating bullish momentum but not yet in overbought territory. This suggests that there is still room for further upside before reaching exhaustion. However, traders should watch for potential divergence or a move above 70, which could indicate overbought conditions and a potential reversal.
Williams %R (14): The Williams %R indicator is at -12.31, signaling that silver is nearing overbought conditions. This suggests that while bullish momentum is strong, a short-term pullback or consolidation may occur before another upward push.
Support and Resistance Levels
Resistance: The first key resistance is at 30.88, aligning with the 0% Fibonacci retracement, a strong barrier this month. A breakout could lead to 31.00, a psychological resistance, with further upside toward 31.20 - 31.50.
Support: Immediate support lies at 30.50 (23.6% Fibonacci retracement), followed by 30.17 (38.2% Fibonacci retracement). If bearish pressure increases, 29.84 (50% Fibonacci retracement) will be a crucial level to watch.
Conclusion and Consideration
Silver (SILVERUSD) on the H4 chart shows a bullish trend, supported by a break above the Ichimoku cloud, a moving average crossover, and strong RSI momentum. However, the Fibonacci 0% resistance at 30.88 has held firm, making it a key level to watch. If silver breaks above this resistance, a rally towards 31.00 or higher is likely. Conversely, failure to break could lead to profit-taking and a retracement towards 30.50 or lower.
Upcoming US economic data releases, particularly GDP growth and jobless claims, could introduce volatility. A stronger USD may weigh on silver prices, while weaker data could support further gains. Traders should monitor key support and resistance levels closely and adjust their strategies accordingly.
Disclaimer: The analysis provided for SILVER/USD is for informational purposes only and does not constitute investment advice. Traders are encouraged to perform their own analysis and research before making any trading decisions on SILVERUSD. Market conditions can change quickly, so staying informed with the latest data is essential.
FXGlory
01.30.2025