Daily Market Analysis By FXOpen

Bitcoin Rollercoaster Price Action Continues

btc.jpg


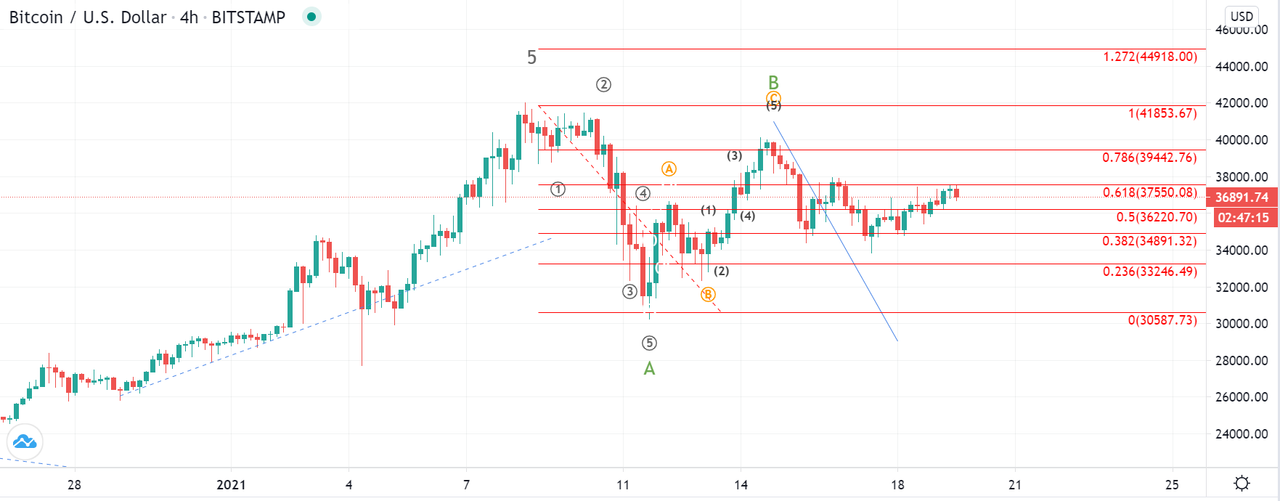
Bitcoin held the headlines into the end of the trading year. It rose from $10,000 in October to $35,000 in late December, tripling in value in less than two months.

Much of the advance, though, came in low liquidity and when “no one was looking”. Just like in 2017 when Bitcoin reached close to $20k, the advance in late 2020 happened during the thin trading environment caused by the end of year holidays.

What Causes Bitcoin Bullishness?

Recently, more and more institutional investors turn to Bitcoin. Viewed as a safe-haven asset and a store of value that competes with gold, the digital alternative investment opportunity offered by Bitcoin appeals to more and more people.

Scarcity is one attribute that many investors value. As the number of Bitcoins is limited, the scarcity makes it possible for the price of it to advance so fast and so aggressive.

But the same is valid in downturns. As 2021 just started, Bitcoin is down 15% from the highs, trading below $29k at the time of writing this article after it was as high as $35k in late December. Anyone happy with such drawdowns should not have any problem in owning Bitcoin – though few investors are willing to take such an asset into a professional portfolio.

Risks for Bitcoin

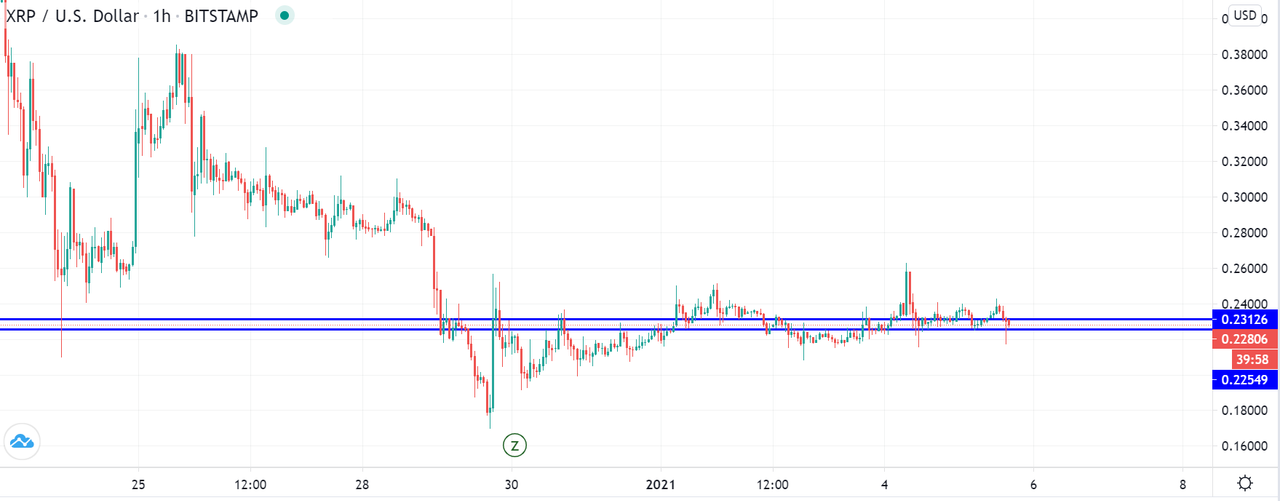
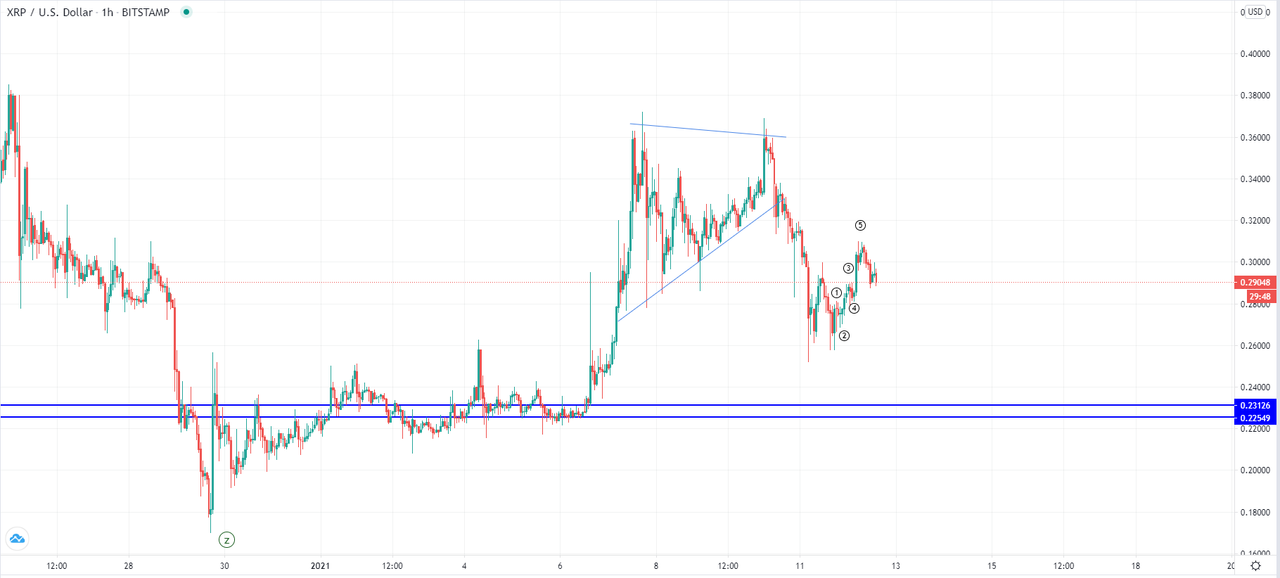
The risks for Bitcoin moving into 2021 trading come from regulation. We saw at the end of last year’s trading that Ripple suffered from the SEC in the United States initiating a lawsuit against its founders, causing the price of Ripple to collapse instantly. If the allegations of illegally selling securities are extended to other crypto assets, the risk is that Bitcoin will suffer from collateral damage too.

Already at this point, many public companies and institutional investors announced huge investments in Bitcoin. We talk about billions, as MicroStrategy is just an example of a company that invested most of its treasury in Bitcoin.

Should the price of Bitcoin continue to retrace from the highs, some weak hands may be forced to liquidity. This may also be exacerbated by a possible reversal in the USD. If that happens, then Bitcoin has more room to correct.
 
BTC and XRP – Consolidation developing but for how long?
btc.jpg


BTC/USD

The price of Bitcoin has been in a decline since Sunday when it reached $34,716 at its highest point. We have seen a downfall to $30,367 but the price spiked further to $27,774 at its lowest wick before snapping back above the 0 Fib level. Currently, it is being consolidated above it and is moving sideways, sitting at $31,901 and is in an upward trajectory.
btcusd-1h.png


Looking at the hourly chart, we can see that the price completed another five-wave impulse to the upside that started on the 21st of December. This rise was most likely the ending wave of the higher degree count which is why now we are seeing some consolidation. The price action may continue to move sideways for some time now but if the 5th wave of a higher degree is in, then the price is now likely to decline further in a corrective manner.

From Sunday’s high, we have seen a three-wave decrease which could have been a local correction which would mean that another minor higher high could come, but in that case, the current move should be the developing lower degree impulse which doesn’t look like one. This is why it is more likely that now we are seeing a corrective increase before further impulsive moves to the downside.

XRP/USD

The price of Ripple has been in a recovery attempt since the 29th of December when it fell to the $0.18 area, but it hasn’t moved that much to the upside, only reaching $0.2588 on yesterday’s high. Since then another move to the downside was made to around $0.225 level, slightly above which it is currently being traded.
xrpusd-1h.png


On the hourly chart, you can see that the price of Ripple is moving around its significant horizontal support zone as its attempting to establish support. This lookout for support is being made after a sharp and impulsive decline ended which was the Z wave from the complex correction count.

This is why now another wave to the upside is to start, but it is still uncertain whether or not it’s going to be an impulsive move or another corrective increase before a further decline. Considering the amount of decrease we have seen prior it is more likely that the price is now going to make a recovery but the bearish sentiment is still holding it behind the general market. This is why the price now has to establish a new bottom, potentially revisiting the lower range of the support zone in order to activate buying and chasing of the price that could cause a recovery.
 
GBP/USD and EUR/GBP: British Pound Could Correct Lower
GBPUSD-Cable-Sterling.jpg


GBP/USD extended its rise towards 1.3700 before starting a downside correction. EUR/GBP is showing positive signs and it could surge if it breaks the 0.9050 resistance.

Important Takeaways for GBP/USD and EUR/GBP

  • The British Pound traded towards the 1.3700 zone, where it faced a strong selling interest.
  • There is a key bullish trend line forming with support near 1.3580 on the hourly chart of GBP/USD.
  • EUR/GBP started a fresh increase and it broke the 0.9000 resistance zone.
  • There is a major bearish trend line in place with resistance near 0.9045 on the hourly chart.

GBP/USD Technical Analysis

In the past few days, there was a steady increase in the British Pound above the 1.3500 resistance zone against the US Dollar. The GBP/USD pair broke the 1.3600 zone to continue higher.

The pair gained momentum above 1.3620 and it even spiked above the 1.3700 resistance. A new multi-month high was formed near 1.3703 on FXOpen before the pair started a downside correction. It traded below the 1.3650 support level and the 50 hourly simple moving average.
gbpusd-chart.png


There was a break below a key rising channel with support near 1.3680 on the hourly chart of GBP/USD. It opened the doors for more losses and the pair dived below 1.3600. It traded as low as 1.3540 and it is currently correcting higher.

There was a break above the 50% Fib retracement level of the downward move from the 1.3703 high to 1.3540 low. There is also a key bullish trend line forming with support near 1.3580 on the same chart.

On the upside, the pair is facing a strong resistance near the 1.3620 level, the 50 hourly simple moving average, and the 1.3650 zone. A clear break above the 1.3650 zone is needed for a fresh move towards 1.3700 or even higher.

Conversely, the pair could break the trend line support and continue lower below 1.3580. The next major support is at 1.3540, below which the pair could test the 1.3500 support.

EUR/GBP Technical Analysis

The Euro traded as low as 0.8931 before it started a fresh increase against the British Pound. The EUR/GBP pair broke the 0.8980 and 0.9000 resistance levels to move into a positive zone.

The pair gained pace above 0.9000 and it even settled above the 50 hourly simple moving average. There was a break above the 50% Fib retracement level of the key downward move from the 0.9092 swing high to 0.8931 low.
eurgbp-chart.png


The pair even tested the 0.9050 resistance zone, and the 76.4% Fib retracement level of the key downward move from the 0.9092 swing high to 0.8931 low.

On the upside, there is a major bearish trend line in place with resistance near 0.9045 on the hourly chart. The main resistance is near the 0.9050 level. A clear break above the trend line resistance may possibly increase the chances of a strong rise towards the 0.9100 level.

Conversely, the pair could start a fresh decline. The main support is forming near the 0.9000 area and the 50 hourly SMA. If there is a downside break below the 0.9010 and 0.9000 support levels, the pair could continue to move down towards the 0.8950 level in the near term.
 
LTC and EOS – Establishing support before new highs
ltc-1.jpg


LTC/USD

The price of Litecoin has been increasing since last week and came up from $124.2 at its lowest point on Saturday to $170 at its highest on Monday. This week has started with a pullback to $147.2 but the price is back on the same levels as on Monday.
ltcusd-1h.png


Looking at the hourly chart, you can see that the price made an interaction with the horizontal resistance found at the $170 level and fell back to its ascending trendline. As it found support there again it is currently making another breakout attempt.

If the price makes a higher high and continued moving past the $170 level it would serve as an early indication that the price is going to continue its bullish trajectory past the upper ascending trendline as well.

But if it fails to do so we might be seeing the completion of the higher degree ending diagonal which formed on the 24th of December. If this is the case then the currently seeing breakout attempt might end as a slightly higher high just making an interaction with the upper ascending trendline before we see a downturn.

However, currently, there are more signs of bullishness than bearishness which is why the uptrend continuation looks more likely.

EOS/USD

From the start of January when the price of EOS was sitting at $2.55 we have seen an increase of 35.68% measured to its highest point at $3.4617 made yesterday. Since then the price made a minor pullback to $3.11 but is now back above $3.315 again.
eosusd-1h.png


On the hourly chart, you can see that the price action made a cup and handle formation since the 20th of December and has now made a higher high compared to the one then. We are now seeing the formation of the handle pattern which is set to consolidate the price and establish support before it can move to the upside again.

From the start of the year, the price has moved parabolically to the upside so its upward trajectory would be expected to continue, but not before it makes a revisiting to the zone below $3.27. It could continue to its more significant horizontal zone at around $2.9 but that doesn’t look as likely considering the bullish momentum seen. More likely we are to see another spike to the downside like we have from yesterday’s high potentially coming to the $3 mark which is both a psychological level and the local horizontal support.

After this, a further upside would be expected for the price of EOS in the same impulsive manner as it did from the start of the new year. The next significant price point would be at $3.84 where the price made the previous high on November 25th.
 
Last edited:
Gold Price Trims Gains While Oil Price Turns Bullish Above $50
Gold-price-oil-price.jpg


Gold price started a downside correction after surging towards $1,960. Conversely, crude oil price is following a strong bullish path and it settled above $50.00.

Important Takeaways for Gold and Oil
  • Gold price started a fresh increase towards $1,950-$1,960 and recently corrected lower against the US Dollar.
  • There was a break below a major bullish trend line with support near $1,920 on the hourly chart of gold.
  • Crude oil price surged above the $48.00 resistance and it even broke the $50.00 barrier.
  • There is a key rising channel forming with support near $50.60 on the hourly chart of XTI/USD.

Gold Price Technical Analysis

Gold price started a fresh increase above the $1,910 resistance level against the US Dollar. The price broke the $1,925 and $1,950 resistance levels to move into a positive zone.

The price even traded close to the $1,960 before it faced sellers. A swing high was formed near $1,959 on FXOpen before the price started a downside correction. There was a sharp decline below the $1,950 and $1,940 levels.
gold-price-chart.png


During the decline, there was a break below a major bullish trend line with support near $1,920 on the hourly chart of gold. The price traded below the 50% Fib retracement level of the upward move from the $1,872 swing low to $1,959 high.

It even settled below the $1,920 level and the 50 hourly simple moving average. It seems like the price is approaching the $1,905 and $1,900 support levels. The 61.8% Fib retracement level of the upward move from the $1,872 swing low to $1,959 high might also provide support.

Any more losses could lead the price towards the $1,880 support level. Conversely, the price could attempt a fresh increase above the $1,915 and $1,920 resistance levels.

A successful close above the $1,920 and the 50 hourly simple moving average could open the doors for a decent increase in the coming sessions. The next major resistance is near the $1,950 level.

Oil Price Technical Analysis

Crude oil price started a steady rise after it broke the key $48.00 resistance zone against the US Dollar. The price broke many hurdles near $50.00 to move further into a positive zone.

The price even broke the $51.00 level and settled above the 50 hourly simple moving average. It traded to a new multi-month high near $51.26 before starting a downside correction. It declined towards $50.50 level and it is currently rising.
oil-price-chart.png


There was a break above the $50.80 resistance. The price recovered above the 50% Fib retracement level of the recent decline from the $51.26 high to $50.43 low.

It is now trading above the 76.4% Fib retracement level of the recent decline from the $51.26 high to $50.43 low. Therefore, there are high chances of a break above the $51.20 and $51.50 resistance levels in the coming sessions.

On the downside, an initial support is near the $50.80 level. There is also a key rising channel forming with support near $50.60 on the hourly chart of XTI/USD.

If there is a downside break below the channel support trend line, the price could decline towards the $50.00 support level. The next major support sits near the $49.55 level.
 
GBP/USD Could Decline Further, USD/CAD Is Eyeing Upside Break
gbpusd.jpg


GBP/USD started a fresh decline after it failed to clear the 1.3700 resistance. USD/CAD is rising and it is currently eyeing an upside break above 1.2750.

Important Takeaways for GBP/USD and USD/CAD

  • The British Pound started a major downside correction from well above 1.3650.
  • There is a major bearish trend line forming with resistance near 1.3610 on the hourly chart of GBP/USD.
  • USD/CAD started a fresh increase after forming a support base near the 1.2660 level.
  • There was a break above a key bearish trend line with resistance at 1.2700 on the hourly chart.

GBP/USD Technical Analysis

After a decent increase, the British Pound faced resistance near 1.3680-1.3700 against the US Dollar. As a result, the GBP/USD pair started a fresh decline and broke a couple of important supports near 1.3650.

The pair gained bearish momentum below the 1.3600 level and the 50 hourly simple moving average. It even broke a major support zone at 1.3540 to move into a bearish zone. It traded as low as 1.3496 on FXOpen, and the pair is currently consolidating losses.
gbpusd-chart-1.png


An initial resistance on the upside is near the 1.3525 level. It is close to the 23.6% Fib retracement level of the recent decline from the 1.3635 high to 1.3496 low.

The first major resistance is near the 1.3540 level (the recent breakdown zone). The next resistance is near the 1.3565 zone and the 50 hourly simple moving average. It is also close to the 50% Fib retracement level of the recent decline from the 1.3635 high to 1.3496 low.

Finally, there is a major bearish trend line forming with resistance near 1.3610 on the hourly chart of GBP/USD. Clearly, the pair is likely to face many hurdles if it starts an upside correction from the recent low of 1.3496.

On the downside, the first key support is near the 1.2500 area. The next major support is near the 1.3470 level, below which there is a risk of a sharp decline.

USD/CAD Technical Analysis

The US Dollar traded as low as 1.3629 before starting a decent upward move against the Canadian Dollar. The USD/CAD pair broke the 1.3650 and 1.3665 resistance levels to move into a short-term bullish zone.

The pair gained pace above the 1.3700 level and the 50 hourly simple moving average. Moreover, there was a break above a key bearish trend line with resistance at 1.2700 on the hourly chart.
usdcad-chart.png


The pair even broke 1.2720, and climbed above the 50% Fib retracement level of the downward move from the 1.2797 high to 1.2629 swing low. It is now attempting an upside break above another bearish trend line with resistance at 1.2750 on the same chart.

The next key resistance is near the 1.2760 level. It is close to the 76.4% Fib retracement level of the downward move from the 1.2797 high to 1.2629 swing low.

A clear break above the 1.2750 and 1.2760 resistance levels may possibly increase the chances of a strong upward move in the coming sessions. The next key resistance sits at 1.2800.

Conversely, USD/CAD might start another decline if it fails near 1.2750. An initial support is near the 1.2700 level and the 50 hourly SMA. The main support seems to be forming near 1.2665.
 
The USD Reverses Course as the NFP Misses Expectations
usd.jpg


Last week brought some troubling events in the United States, as protesters took the Capital by assault. Lives were lost, and the nation faces an identity crisis.

Shortly after the order was restored, President Trump recognized President-elect Biden’s victory and ensured people that there would be a peaceful transition of power on the 20th of the month when the new administration takes charge.

But it was too little too late. In the meantime, Twitter suspended the President’s account, and America is on a race to identify each and every one of the protesters.

As such, the economic data paled in the face of the political events. However, the USD did move, as it seems that it reversed course, easing from the highs.

What Did the NFP Show?

The NFP report released last Friday showed the data for the month of December 2020. The U.S. economy lost 140k jobs, much worse than the expectations of adding 60k.

Unsurprisingly, the leisure and hospitality sectors were responsible for most of the job losses, as the pandemic continues to take its toll. However, the November numbers were revised higher, and the unemployment rate remained stable, somehow diminishing the impact of the December report.

ISM Manufacturing Above 60

One of the most striking pieces of economic data released last week was the ISM Manufacturing. It climbed above 60, and most of the time, when it did so in the past, the dollar strengthened in the following one hundred days.

The thing is that all investment houses predict a lower dollar in 2021. Whenever such a consensus exists, the danger is that exactly the opposite happens.

So far, the dollar reflected the risk-on environment, as it moved hand in hand with the U.S. equities. As the new administration prepares to run America, the dollar may be in the grasp of a sharp reversal.

The EURUSD is already down two big figures from the highs, and AUDUSD and GBPUSD correct as well. If the dollar’s strength continues, the world risks being caught on the wrong side of the market, as most traders are positioned for a weak dollar.
 
BTC and XRP – Has the correction ended?
btcxrp.jpg


BTC/USD

From yesterday’s low at $30,340 the price of Bitcoin has increased by 20.71% as it came to $36,743 at its highest point today. Since then it has made a minor retracement and is currently sitting at around $35,340 and is in a downward trajectory.
btcusd-1h-1.png


Looking at the hourly chart, you can see that the price increase that ended on Friday was the ending wave from the higher degree count. This is why now we are seeing the development of the five-wave descending move. As it might have ended the price would now be expected to recover but as this is most likely the beginning of the descending move from the downside we are to see the downtrend continuation after the recovery has been made.

If we are seeing the development of the ABC correction the price of Bitcoin could fall back to the $23,500 range before the correction ends. There could be a possibility that this would be a five-wave impulse rather than the ABC correction in which case the decrease could continue below $23,500.

In the short-term, we are expecting that the price establishes support around the $30,000 area before a recovery to $37,550 which would be the 0.618 Fib level.

XRP/USD

The price of Ripple has also been increasing and came up from $0.2575 at its lowest point yesterday to $0.308 at its highest today which was an increase of around 20%, but since today’s high made a pullback to the $0.29 area where is currently being traded.
xrpusd-1h-1.png


On the hourly chart, we can see that this increase was the formation of the first five-wave impulse to the upside after a sharp and steep decline from $0.36 which is a 26.7% decrease measured to yesterday’s low. This decrease made from Sunday was made after the price broke out from the forming triangle in which it was consolidating and was retesting its horizontal resistance level on which the price came up at its prior high.

The downfall seen could be the corrective wave to the downside after which now we are seeing the next impulse to the upside forming. As a lower degree five-wave count has been completed it will now be seen if this is the start of the higher degree wave 5 or the corrective ABC before further downside movement. The price is now likely to make another five-wave move in either way to the upside from whose momentum we are to evaluate either possibilities.
 
EUR/USD Could Start Fresh Increase, USD/CHF Shows Bearish Signs
euro-4.jpg


EUR/USD remained well bid above 1.2120 and it is currently rising. USD/CHF is declining and it might continue to move down towards the 0.8820 support zone.

Important Takeaways for EUR/USD and USD/CHF

  • The Euro declined heavily from 1.2350, but it found support near 1.2130 against the US Dollar.
  • There was a break above a major bearish trend line with resistance near 1.2200 on the hourly chart of EUR/USD.
  • USD/CHF formed a short-term top near 0.8920 and recently corrected lower.
  • There was a break below a key bullish trend line with support near 0.8888 on the hourly chart.

EUR/USD Technical Analysis

After a steady increase, the Euro faced a strong resistance near the 1.2350 zone against the US Dollar. The EUR/USD pair formed a swing high at 1.2344 and started a strong decline.

It broke many key supports near 1.2240 and 1.2220. There was also a break below the 1.2180 support level and the 50 hourly simple moving average. Finally, the pair found support above 1.2130. A low is formed near 1.2133 on FXOpen and the pair is currently rising.
eurusd-chart.png


It broke the 1.2180 resistance level and the 50 hourly simple moving average. There was a break above the 23.6% Fib retracement level of the downward move from the 1.2344 high to 1.2133 low.

There was also a break above a major bearish trend line with resistance near 1.2200 on the hourly chart of EUR/USD. The pair is now trading above the 1.2200 level. An initial resistance is near the 1.2222 level. The first major resistance is near the 1.2240 level.

The 50% Fib retracement level of the downward move from the 1.2344 high to 1.2133 low is also near 1.2240 level. Therefore, a break above 1.2240 could accelerate upsides towards 1.2300.

If not, the pair could start a fresh decline from 1.2240. An initial support is near the 1.2185 level. The next major support is near the 1.2170 level. Any more losses could lead the pair towards the 1.2100 zone.

USD/CHF Technical Analysis

The US Dollar followed a strong bullish path above the 0.8850 level against the Swiss franc. The USD/CHF pair even broke the 0.8900 level, but it struggled to clear the 0.8920 zone.

A high was formed near 0.8920 before the pair started a downside correction. There was a break below the 0.8900 support level and the 50 hourly simple moving average to open the doors for a major correction.
usdchf-chart.png


There was also a break below a key bullish trend line with support near 0.8888 on the hourly chart. The pair broke the 50% Fib retracement level of the upward move from the 0.8822 swing low to 0.8920 high.

The pair could continue to move down towards the 0.8845 support. It is close to the 76.4% Fib retracement level of the upward move from the 0.8822 swing low to 0.8920 high. Any more losses might call for a test of the 0.8820 support.

On the upside, an initial resistance is near the 0.8870 level. The main resistance is forming near the 0.8890 level and the 50 hourly simple moving average.

A close above the 0.8880 and 0.8890 levels could open the doors for another steady increase above 0.8900 in the near term.
 
Gold Price Prepares for Next Move, Oil Price Holds Strong
oil-and-dollars.jpg


Gold price started a fresh decline and settled below $1,880. Conversely, crude oil price gained bullish momentum and it traded to a new multi-month high close to $54.00.

Important Takeaways for Gold and Oil

  • Gold price started a fresh decline below the $1,900 and $1,880 support levels against the US Dollar.
  • There is a key contracting triangle forming with resistance near $1,855 on the hourly chart of gold.
  • Crude oil price surged above the $50.00 resistance and it even climbed towards $54.00.
  • There was a break above a declining channel with resistance near $53.00 on the hourly chart of XTI/USD.

Gold Price Technical Analysis

Gold price failed to clear the $1,960 resistance level, and started a fresh decline against the US Dollar. The price broke the $1,900 and $1,880 support levels to move into a bearish zone.

The price followed a bearish path below the $1,850 level and settled below the 50 hourly simple moving average. It traded as low as $1,815 on FXOpen and recently started a short-term upside correction.
gold-price-chart-1.png


There was a break above the $1,825 and $1,830 levels. The price recovered above the 23.6% Fib retracement level of the downward move from the $1,959 swing high to $1,815 low. However, the price is facing hurdles near $1,855 and $1,860.

There is also a key contracting triangle forming with resistance near $1,855 on the hourly chart of gold. A clear break above the triangle resistance could open the doors for a move towards the $1,880 resistance.

The next resistance could be near the 50% Fib retracement level of the downward move from the $1,959 swing high to $1,815 low at $1,887.

Conversely, the price could break the triangle support and continue lower below the $1,840 level. The first key support is near the $1,825 level. The next major support is at $1,815, below which the price might even dive below the $1,800 support level.

Oil Price Technical Analysis

Crude oil price started a strong rise after it broke the $50.00 resistance zone against the US Dollar. The price gained bullish momentum and it even surpassed the $52.00 level.

The bulls remained in action, resulting in a clear break above $52.50. Recently, there was a break above a declining channel with resistance near $53.00 on the hourly chart of XTI/USD. The price traded to a new multi-month high close to $54.00 and settled above the 50 hourly simple moving average.
oil-price-chart-1.png


The recent high was formed near $53.85 and the price is currently correcting lower. It is testing the $53.50 level, which is close to the 23.6% Fib retracement level of the recent wave from the $52.27 swing low to $53.85 high.

If there are more downsides, the price could test the $53.20 support and the 50 hourly simple moving average. The next major support is near the 50% Fib retracement level of the recent wave from the $52.27 swing low to $53.85 high.

Any more losses could lead the price towards the $52.60 support zone. On the upside, the $53.85 and $54.00 levels are initial hurdles. A clear break above $54.00 may possibly lead the price towards the $55.00 level in the near term.
 
GBP/USD and GBP/JPY: British Pound Could Correct Lower
gbp-1.jpg


GBP/USD gained strength above 1.3600, but it struggled to continue higher above 1.3700. GBP/JPY also corrected lower after forming a short-term top near 142.25.

Important Takeaways for GBP/USD and GBP/JPY

  • The British Pound tested the 1.3700 resistance zone before correcting lower.
  • There was a break below an ascending channel with support near 1.3638 on the hourly chart of GBP/USD.
  • GBP/JPY also corrected lower from 142.25 and declined below 141.50.
  • There was a break below a major bullish trend line with support near 141.20 on the hourly chart.

GBP/USD Technical Analysis

This past week, the British Pound saw a steady increase above the 1.3550 resistance against the US Dollar. The GBP/USD pair even broke the 1.3600 resistance zone to move further into a positive zone.

The pair climbed above the 1.3650 and 1.3680 resistance levels, but it struggled to gain momentum above 1.3700. A high was formed near 1.3710 on FXOpen and the pair recently started a downside correction.
gbpusd-chart-2.png


There was a break below the 1.3650 and 1.3620 support levels. There was also a close below the 1.3620 level and the 50 hourly simple moving average. Moreover, there was a break below an ascending channel with support near 1.3638 on the hourly chart of GBP/USD.

The pair traded as low as 1.3565 and it is currently consolidating losses. An initial resistance on the upside is near the 1.3600 zone. It is close to the 23.6% Fib retracement level of the recent decline from the 1.3710 high to 1.3565 low.

The first key resistance is forming near the 1.3620 level. The next major resistance is near the 1.3640 level and the 50 hourly simple moving average. It is close to the 50% Fib retracement level of the recent decline from the 1.3710 high to 1.3565 low.

If there is an upside break above 1.3620 and 1.3640, GBP/USD could easily drift towards the 1.3700 zone. On the downside, the 1.3565 level is a decent support. If there is a downside break below the recent low, the pair could continue to move down towards the 1.3500 support level in the near term.

GBP/JPY Technical Analysis

The British Pound formed a short-term top near the 142.25 before it started a downside correction against the Japanese Yen. The GBP/JPY pair traded below the 141.80 support level to start the recent decline.

There was a clear break below the 141.50 support level and the 50 hourly simple moving average. There was also a break below a major bullish trend line with support near 141.20 on the hourly chart. The pair cleared the 50% Fib retracement level of the upward move from the 140.34 low to 142.25 high.
gbpjpy-chart.png


It is now trading well below the 141.20 level. It is testing the 76.4% Fib retracement level of the upward move from the 140.34 low to 142.25 high.

The next major support is near the 140.60 level, below which the pair could dive towards the 140.00 support zone in the coming sessions. On the upside, the previous support near 141.30 might act as a resistance.

The first major resistance is near the 141.50 level and the 50 hourly simple moving average. If GBP/JPY climbs above 141.30 and 141.50, it could revisit the 142.25 zone in the coming sessions.
 
Important Week for Global Policy Rates
img-03.jpg


The week ahead of us is critical for the currency market. On Wednesday, we have the inauguration day in the United States, as Joe Biden will officially become the new President. The Biden’s administration economic agenda is based on three pillars – fiscal stimulus, infrastructure spending, bringing back the Obamacare program – and the markets will closely monitor the developments in these three areas.

One day later, FX traders have the first major central bank meeting of the year, as the European Central Bank (ECB) announces its decision this coming Thursday. The central bank made it clear that the Euro is too high and that the higher EURUSD exchange rate weighs on inflation, but that did not stop the EURUSD rate from reaching 1.23.

In the meantime, the exchange rate eased from the highs, trading below 1.21 – is this the start of a new cycle for the EURUSD pair?
important-week-for-global-policy-rates.jpg


Fed vs. ECB

The pandemic caught the ECB already having the interest rate in negative territory. In the aftermath of the European sovereign crisis in 2012, the ECB lowered the deposit facility below zero, where it still is at present. As such, the central bank was forced to use other unconventional tools to ease the policy during the pandemic.

So did the Fed. But the Fed opted to avoid negative rates and to focus more on stimulating the business environment by printing huge amounts of new dollars. In 2020 alone, the Fed printed over 30% of all the dollars ever created. Yet, this did not translate into inflation, although it is too early to tell at this point if inflation will be a theme in the years ahead.

The Fed’s actions sent the dollar lower, and the ECB and other central banks had little or no power to stop the dollar’s decline. As such, the Euro and the other G10 currencies, all appreciated against the dollar.

Now that the crisis is adverted, as suggested by the available vaccines and the vaccination programs around the world, the market may choose to revert the dollar decline theme seen during the pandemic. If that is the case, this week, we should see the first signs of a trend change.

Global policy rates are close to zero and are expected to remain so for the foreseeable future. Only in 2023 and beyond the major central banks are forecasted to lift the rates. However, even then, the ECB’s deposit facility rate is predicted to remain below zero.

Therefore, judging by the interest rate differential that exists and will keep existing in the years ahead, the market may see a sharp reversal in the EURUSD exchange rate.
 
BTC and XRP – Prices continue to rise
btc-xrp.jpg


BTC/USD

The price of Bitcoin has been moving sideways since last week as it came up to $40,000 area but then fell to $33,813 at its lowest point yesterday. This occurred after recovery and now we are seeing another minor one with the price reaching $37,486. Currently, it is being traded slightly lower but is still in an upward trajectory.
btcusd-1h-2.png


Looking at the 4 hour chart, you can see that the price made it slightly below the 0.382 Fib level on Sunday’s low but managed to pull back up above it. This could indicate that support has been found but we are still yet to see if it manages to exceed the local high at the 0.618 Fib level.

The primary scenario is one in which we are seeing an ABC correction of a higher degree and so far this has played out. The downfall below the 0.5 Fibonacci level has confirmed the previously assumed ABC to the upside which is the B wave from the higher degree count.

This is why from here we would be expecting the continuation to the downside, but that might not come as expected. The C wave which was projected to the downside should have been developing a five-wave impulse but has instead made a three-wave decrease followed by a recovery.

Now if the price continues increasing this count might get invalidated but this would potentially still be the part of the correctional count which is set to push the price lower.

XRP/USD

The price of Ripple has been increasing and came up by 13.87% from its yesterday’s low at $0.2714 to $0.309 where it is now being traded.
xrpusd-1h-2.png


On the 4-hour chart, you can see that the price broke out from the descending triangle on the upside after the third interaction with the horizontal support level was made. As the price found support there we have seen a bounce that led the price for a breakout and a higher high was made compared to the previous local one.

This could be the start of the 5th wave from the five-wave impulse that started in December last year after the price made the end of the significant downside move. The price hasn’t made it inside the territory of the 1st wave which makes this scenario valid and now if we are seeing the development of the 5th wave it is set to push the price of Ripple higher then on the 7th of January where the ending point of the 3rd wave is.
 
EUR/USD Recovering Losses, USD/JPY Remains At Risk
Euro-EUR.jpg


EUR/USD started a downside correction from well above 1.2300 and recently found support near 1.2055. USD/JPY is showing bearish signs and it could decline heavily below 103.50.

Important Takeaways for EUR/USD and USD/JPY

  • The Euro remained well bid above 1.2050 and started a fresh increase.
  • There was a break above a major bearish trend line with resistance near 1.2120 on the hourly chart of EUR/USD.
  • USD/JPY is declining and showing bearish signs below the 104.00 resistance.
  • There is a key bearish trend line forming with resistance near 103.98 on the hourly chart.

EUR/USD Technical Analysis

In the past few days, there was a steady decline in the Euro from well above 1.2200 against the US Dollar. The EUR/USD pair even broke the 1.2120 support level, but it remained well bid above 1.2050.

A low was formed near 1.2053 on FXOpen before the pair is currently recovering losses. There was a break above the 1.2100 resistance level and the 50 hourly simple moving average, opening the doors for a steady increase.
eurusd-chart-1.png


There was also a break above a major bearish trend line with resistance near 1.2120 on the hourly chart of EUR/USD. The pair even broke the 50% Fib retracement level of the downward move from the 1.2222 swing high to 1.2053 low.

An immediate resistance is near the 1.2058 level. It is close to the 61.8% Fib retracement level of the downward move from the 1.2222 swing high to 1.2053 low. The main resistance is near the 1.2175, above which EUR/USD is likely to accelerate higher.

Conversely, the pair could start a fresh decline below the 1.2135 support. The first major support is near the 1.2115 zone. If there is a downside break below the 1.2115 support zone, the pair could continue to move down. In the stated case, there are high chances of a retest of the 1.2053 swing low in the near term.

USD/JPY Technical Analysis

The US Dollar seems to be trading in a broad range below the 104.20 and 104.50 resistance levels against the Japanese Yen. The USD/JPY pair formed a high near 104.08, and recently started a fresh decline.

There was a break below the 103.85 support level the 50 hourly simple moving average. The pair also declined below the 50% Fib retracement level of the upward move from the 103.63 low to 104.08 high.
usdjpy-chart.png


It is now trading near a key support at 103.75. It is close to the 76.4% Fib retracement level of the upward move from the 103.63 low to 104.08 high. If there is a downside break below the 103.75 level, the pair could move towards the main 103.50 support zone.

The stated 103.50 support holds the key, below which the pair could decline heavily in the near term. On the upside, the first major resistance is near the 103.85 level.

There is also a key bearish trend line forming with resistance near 103.98 on the hourly chart. A clear break above the trend line is must for a steady increase.

The next key resistance could be near 104.20, above which USD/JPY could revisit 104.50. Any more gains may possibly increase the chances of a test of the 105.00 level in the near term.
 
Litecoin and EOS – Bears are in control
ltc.jpg


LTC/USD

The price of Litecoin has been in a decline since Tuesday when it was sitting at $166.11 and made a downfall to $130 level today, which was a decrease of 21.74%. Now the price is being traded slightly higher but is still in a downward trajectory.
ltcusd-1h-1.png


Looking at the hourly chart, you can see that the price made a breakout below the ascending channel that formed since the 11th of January when the price fell to the $112.33 area. From there a recovery was made all the way up above the $160 level but now another impulsive descending move has been seen which is most likely the continuation of the corrective decrease. If this is the three-wave corrective decline from the 10th of January the move to the downside would be expected to continue and surpass the prior low at $112 and could potentially continue all the way down to $82.9.

However, there is a possibility that this is going to be a triangle formation of the higher degree in which this three-wave move could be its first sub-wave. In that case, the price could make another significant recovery before this move to the $82.9 horizontal level. The price has found support at 0.236 Fib level at least a temporary one, so now we are going to see what happens as if it manages to stay up the recovery might come.

EOS/USD

From its Tuesday’s high at $2.926 the price of EOS has decreased by 12.18% as it came down to $2.579 at its lowest wick today. Now the price is looking like it has stabilized above the $2.62 level and is establishing support.
eosusd-1h-1.png


On the hourly chart, you can see that the price has made a breakout from the ascending channel like in the case of Litecoin but the pattern isn’t as similar as the price of EOS made a more significant decrease from the 10th of January till the 11th then it has now since Tuesday. We have seen a decrease of over 37% till the 11th of January and if this descending move is the continuation of that move, the price could be expected to go significantly lower. But another round of hard-selling like it occurred then isn’t likely to play out.

More likely we are going to see a further decrease to some of the horizontal support levels out of which the first one in line would be the 11th January low, but the next one is just below the $2 mark. The price could make another impulsive move to the vicinity of the lower horizontal level, but like in the case of Litecoin that might not come in a straight line.
 
AUD/USD and NZD/USD Approaching Next Key Break
aud-22.jpg


AUD/USD is trading well above 0.7700, but is facing hurdles near 0.7780 and 0.7800. NZD/USD is also showing positive signs, but there is a crucial resistance forming near 0.7225-0.7240.

Important Takeaways for AUD/USD and NZD/USD

  • The Aussie Dollar started a fresh increase above the 0.7720 resistance levels against the US Dollar.
  • There is a major contracting triangle forming with support near 0.7740 on the hourly chart of AUD/USD.
  • NZD/USD also climbed higher, but it is facing a strong resistance near 0.7225 and 0.7240.
  • A key bullish trend line is forming with support near 0.7185 on the hourly chart of NZD/USD.

AUD/USD Technical Analysis

After forming a support base near 0.7660, the Aussie Dollar started a fresh increase against the US Dollar. The AUD/USD pair broke the 0.7700 resistance level to move into a positive zone.

The pair even broke the 0.7720 resistance and settled above the 50 hourly simple moving average. A high is formed near 0.7782 on FXOpen and the pair is currently correcting lower.
audusd-chart-1.png


There was a break below the 0.7760 support level. The pair even traded below the 50% Fib retracement level of the upward move from the 0.7720 swing low to 0.7782 high. It is now testing the 0.7745 support level and the 50 hourly simple moving average.

There is also a major contracting triangle forming with support near 0.7740 on the hourly chart of AUD/USD. The triangle support is close to the 61.8% Fib retracement level of the upward move from the 0.7720 swing low to 0.7782 high.

If there is a downside break below the triangle support, there is a risk of more losses. The next major support on the downside is near the 0.7720 level.

On the upside, the 0.7770 level is an immediate resistance. A clear break above the 0.7770 and 0.7780 levels may possibly open the doors for a larger increase towards 0.7800 and 0.7840 in the coming sessions.

NZD/USD Technical Analysis

The New Zealand Dollar also followed a similar path above the 0.7120 support against the US Dollar. The NZD/USD pair broke the 0.7200 resistance to move back into a positive zone.

However, the pair is facing a strong resistance near the 0.7225 and 0.7240 levels. A high is formed near 0.7225 and the pair is currently correcting lower. It traded below the 0.7200 level, but it is well above the 50 hourly simple moving average.
nzdusd-chart-1.png


It is trading just below the 50% Fib retracement level of the upward move from the 0.7177 swing low to 0.7225 high. On the downside, there is a key bullish trend line forming with support near 0.7185 on the hourly chart of NZD/USD.

The trend line is close to the 76.4% Fib retracement level of the upward move from the 0.7177 swing low to 0.7225 high. If there is a downside break below the trend line support, there is a risk of more losses towards the 0.7150 and 0.7120 support levels.

Conversely, the pair could remain well bid above the 0.7180 support zone. On the upside, the 0.7225 and 0.7240 levels are crucial hurdles. A clear break and close above the 0.7240 level could set the pace for a strong increase towards the 0.7300 level.
 
GBP/USD and EUR/GBP: British Pound Remains Strong

gbpusd.jpg


GBP/USD extended its rise above the 1.3680 and 1.3700 resistance levels. EUR/GBP is correcting lower and it is approaching a major support near 0.8875.

Important Takeaways for GBP/USD and EUR/GBP

  • The British Pound remained well bid above 1.3600 and it climbed above 1.3680.
  • There is a key contracting triangle forming with resistance near 1.3715 on the hourly chart of GBP/USD.
  • EUR/GBP started a fresh decline after it failed to clear the main 0.8920 resistance zone.
  • Earlier, there was a break above a short-term bearish trend line with resistance near 0.0.8860 on the hourly chart.

GBP/USD Technical Analysis

After forming a base above the 1.3500 and 1.3520, there was a fresh increase in the British Pound against the US Dollar. The GBP/USD pair broke the 1.3580 and 1.3600 resistance levels to move into a positive zone.

The pair gained momentum above 1.3600 and it even spiked above the 1.3680 resistance. There was also a break above the 1.3700 zone and the pair settled above the 50 hourly simple moving average.

A new multi-month high was formed near 1.3746 on FXOpen before the pair started a downside correction. It traded below the 1.3680 support level and the 50 hourly simple moving average, but the bulls protected the 1.3640 level.
gbpusd-chart-3.png


A low is formed near 1.3636 and the pair is currently rising. It is trading above the 1.3680 level, the 50 hourly simple moving average, and the 50% Fib retracement level of the downward move from the 1.3746 high to 1.3636 low.

It seems like there is a key contracting triangle forming with resistance near 1.3715 on the hourly chart of GBP/USD. An immediate resistance is near the 1.3700 zone or the 61.8% Fib retracement level of the downward move from the 1.3746 high to 1.3636 low.

A successful break above the 1.3700 and 1.3715 levels could open the doors for a new high above the 1.3746 in the near term. Conversely, the pair could break the triangle support and continue lower towards the main 1.3620 support level.

EUR/GBP Technical Analysis

The Euro started a fresh increase from the 0.8830 low against the British Pound. The EUR/GBP pair broke the 0.8850 and 0.8860 resistance levels to move into a positive zone.

There was also a break above a short-term bearish trend line with resistance near 0.0.8860 on the hourly chart. The pair surged above the 0.8900 level, but it struggled to clear a major hurdle near the 0.8920 zone.
eurgbp-chart-1.png


A high is formed near 0.8918 and the pair is currently declining. It broke the 0.8900 level and tested the 38.2% Fib retracement level of the upward move from the 0.8830 swing low to 0.8918 high.

On the downside, there is a major support waiting near the 0.8875 level and the 50 hourly simple moving average. It is also close to the 50% Fib retracement level of the upward move from the 0.8830 swing low to 0.8918 high.

Any more losses could lead the pair towards the 0.8850 support level in the near term. Conversely, the pair could start a fresh increase from the 0.8875 support zone.

On the upside, the 0.8900 level is a short-term resistance for the Euro bulls. However, the main hurdle is still near 0.8920, above which EUR/GBP could rally towards the 0.9000 resistance.
 
Decisive Week for the Dollar as the Fed’s Meeting Looms Large

usd.jpg


Financial markets started the new year on the same note as the previous year ended – higher stocks, lower dollar. The extent of the advance in the stock market, or the decline in the dollar, led many market participants to wonder if the Fed’s monetary policy did not lead to financial bubbles?

After all, a survey shows that over 25% of the market participants still believe that Bitcoin will double from the current levels. Or, 18% believe that the price of Tesla will double over the next twelve months. That is, in the context of Bitcoin already rising from $10,000 to $40,000 in the last months and Tesla already being up over 650% in 2020.

12.jpg


Will the Dollar Weakness Stop?

To many, the weakness in the dollar is responsible for such extreme price action. If we are to see a change in the trend, as suggested by the 56% of the market participants that expect a higher dollar against Bitcoin for the next twelve months, then the risk may come from Wednesday Fed’s decision.

On Wednesday, the Fed is expected to keep the monetary policy unchanged – the federal funds rate at the lower boundary and the QE program running at $120 billion/month. However, this week, the focus will shift from the FOMC Statement to the Fed’s press conference.

More precisely, it will be more important what the Fed thinks about the future economic outlook. In the face of the rapid pace of vaccinations (i.e., the United States already vaccinated 6% of its population), the risk is that the Fed will deliver a slightly hawkish outlook for the future economic recovery. If that is the case, the dollar may turn in the expectation of the future tapering of the quantitative easing program.

Last week the ECB delivered a slightly hawkish statement too. It said that it may or may not use the full envelope of the PEPP program, despite the fact that many European countries face the worse of the pandemic right now.

As such, one should not discount a hawkish Fed too. If that happens, the USD will make a U-turn because the reflation trade that went on for months now seems to be extremely stretched.

As we saw in 2020, the dollar’s direction matters for the equity markets and other markets too. For stocks to remain close to all-time highs, the correlation with the dollar must break.

Will we see such a divergence on Wednesday? Or will the reflation trade continue after the Fed’s first meeting of the year?
 
BTC and XRP – Bearish scenario expected

btc-xrp.jpg


BTC/USD

From yesterday’s open the price of Bitcoin has increased by 12.44% coming from its lowest point of $31,030 to $34,891 at its highest but has since then made a downfall. The price fell back to the same levels as on yesterday’s low and is now starting to make another recovery attempt. Currently it is sitting at around $32,221.
btcusd-1h-3.png


Looking at the hourly chart, you can see that the price made a recovery from the 22nd of January when it fell to $28,785 at its lowest wick. The decrease to those levels was the completion of the 3rd wave from the corrective structure that started developing after the all-time high.

We could have seen the completion of the correction, but the wave structure is still looking more corrective than impulsive on the recovery that followed. This is why more likely, we are seeing the corrective wave continuation in the form of the second wave X from the WXYXZ complex count.

As you can see the price made a descending triangle from its all-time high and since it made interaction with its resistance level, now we are going to have a validation of the assumed scenario as if the price is in a prolonged correction now the Z wave is shortly going to start developing. That means that now a breakout to the downside would be shortly expected.

If this starts developing the price of Bitcoin could fall back to the $24,000 area where the next significant horizontal support level in line with the downside. This would be a downfall of just over 30% which would be a highly significant one.

XRP/USD

The price of Ripple has been moving sideways from the 22nd of January when it spiked down to $0.24 area from where it made a recovery to $0.28 level. Since the price has been in this horizontal range we have seen further support and resistance testing with the price currently sitting at $0.26645.
xrpusd-1h-3.png


As you can see from the hourly chart, the price has previously made a breakout to the upside from the descending triangle in which it was since the 8th of January but failed to continue moving to the upside. The assumed scenario was the five-wave impulse to the upside but since the price spiked inside the territory of the 1st wave this is starting to get invalidated. Instead, more likely we have seen a three-wave upside corrective move before further downside continuation.

However, the quick spike on the 22nd could have been the completion of the 4th wave although unlikely at this point. In the upcoming period, we are going to see if the invalidation gets confirmed and that is going to be indicated from the breakout direction of the current horizontal range.
 
EUR/USD and EUR/JPY: Euro Eyeing Upside Break

Euro-EURUSD.jpg


EUR/USD is holding the 1.2100 support area, but it is also struggling to clear 1.2200. Similarly, EUR/JPY is facing a strong resistance near 126.15, above which it could start a strong increase.

Important Takeaways for EUR/USD and EUR/JPY

  • The Euro is consolidating in a range above the 1.2100 support zone.
  • There is a major contracting triangle forming with resistance near 1.2170 on the hourly chart of EUR/USD.
  • EUR/JPY is facing a major resistance near the 126.15 and 1.2620 levels.
  • There is a key contracting triangle forming with resistance near 126.15 on the hourly chart.

EUR/USD Technical Analysis

This past week, the Euro climbed above the 1.2150 resistance zone against the US Dollar. However, the EUR/USD pair faced a major resistance near the 1.2200 and 1.2210 levels.

There were a couple of attempts to clear 1.2200, but the bulls failed to gain strength. As a result, there was a sharp decline below 1.2150. The pair broke the 1.2120 support, but it found a strong support near 1.2100.
eurusd-chart-2.png


A low was formed near 1.2107 before the pair bounced back to 1.2175. A high is formed near 1.2175 on FXOpen and it is currently correcting lower.

The pair is testing the 23.6% Fib retracement level of the recent wave from the 1.2107 swing low to 1.2175 high. The first major support on the downside is near the 1.2150 level and the 50 hourly simple moving average.

The next major support is near the 1.2140 level. It is close to the 50% Fib retracement level of the recent wave from the 1.2107 swing low to 1.2175 high. On the upside, an immediate resistance is near the 1.2175 level.

There is also a major contracting triangle forming with resistance near 1.2170 on the hourly chart of EUR/USD. A clear break above the triangle resistance could push the pair towards the main 1.2200 resistance zone.

If EUR/USD clears the 1.2200 resistance zone, there could be a strong increase. In the stated case, the pair could easily rise towards 1.2250 or 1.2265.

EUR/JPY Technical Analysis

The Euro also followed a similar path after it faced seller near 1.2640 against the Japanese Yen. The EUR/JPY pair broke the 126.00 support level, but it remained stable above the 125.70 level.

A low is formed near 125.69 and the pair is currently rising. There was a clear break above the 126.00 level and the 50 hourly simple moving average. The pair also climbed above the 50% Fib retracement level of the recent decline from the 126.39 high to 125.69 low.
eurjpy-chart.png


It is now facing resistance near the 126.12 level. It represents the 61.8% Fib retracement level of the recent decline from the 126.39 high to 125.69 low.

There is also a key contracting triangle forming with resistance near 126.15 on the hourly chart. A clear break above the triangle resistance and 126.20 could open the doors for more upsides. The next major resistance is near 126.40, above which the bulls might aim a test of the 127.00 level.

Conversely, the pair could drop below the 126.00 level and the 50 hourly SMA. In the stated case, it could test the triangle support at 125.90. Any more losses could open the doors for a drop towards the 125.50 level in the near term.
 
Back
Top Bottom