FXOpen Trader
Well-known member
EUR/USD Extends Decline, USD/CHF Gains Momentum

EUR/USD started a fresh decline from well above the 1.1350 pivot zone. USD/CHF is rising, and it might extend gains above the 0.9350 level.
Important Takeaways for EUR/USD and USD/CHF
EUR/USD Technical Analysis
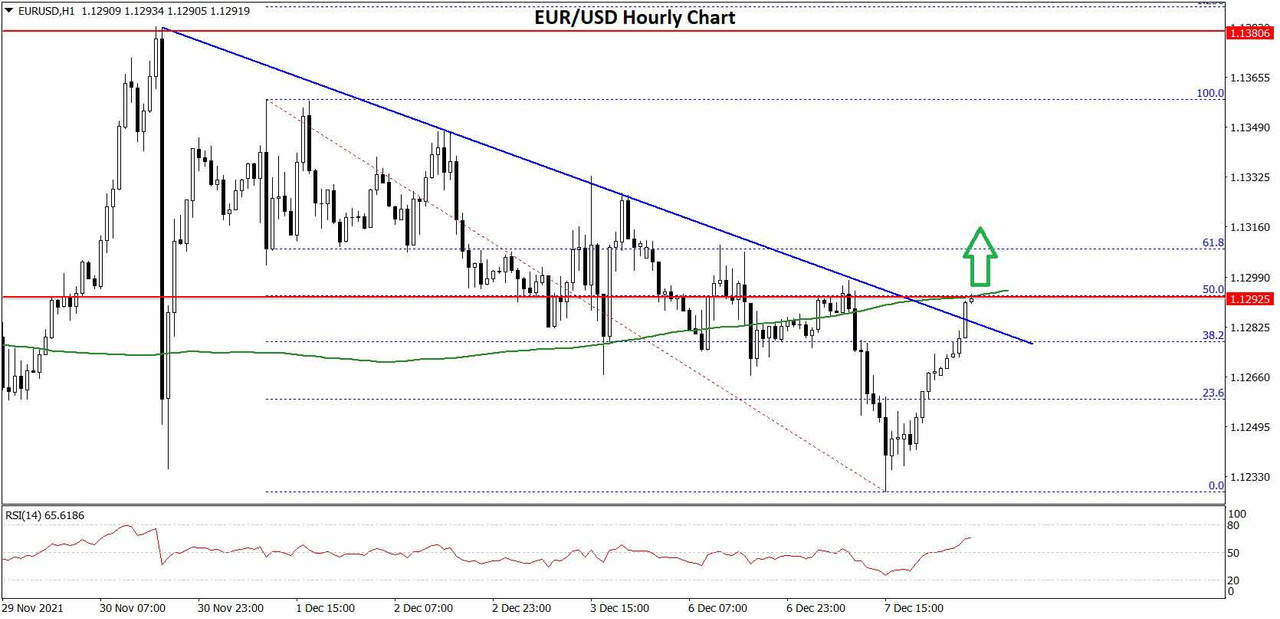
The Euro attempted an upside break above the 1.1400 resistance zone against the US Dollar. The EUR/USD pair failed to gain strength and started a fresh decline.
There was a clear break below the 1.1350 and 1.1300 support levels. The pair even broke the 1.1250 support and the 50 hourly simple moving average. Finally, there was a move below the 1.1230 level and a low is formed near 1.1226 on FXOpen.
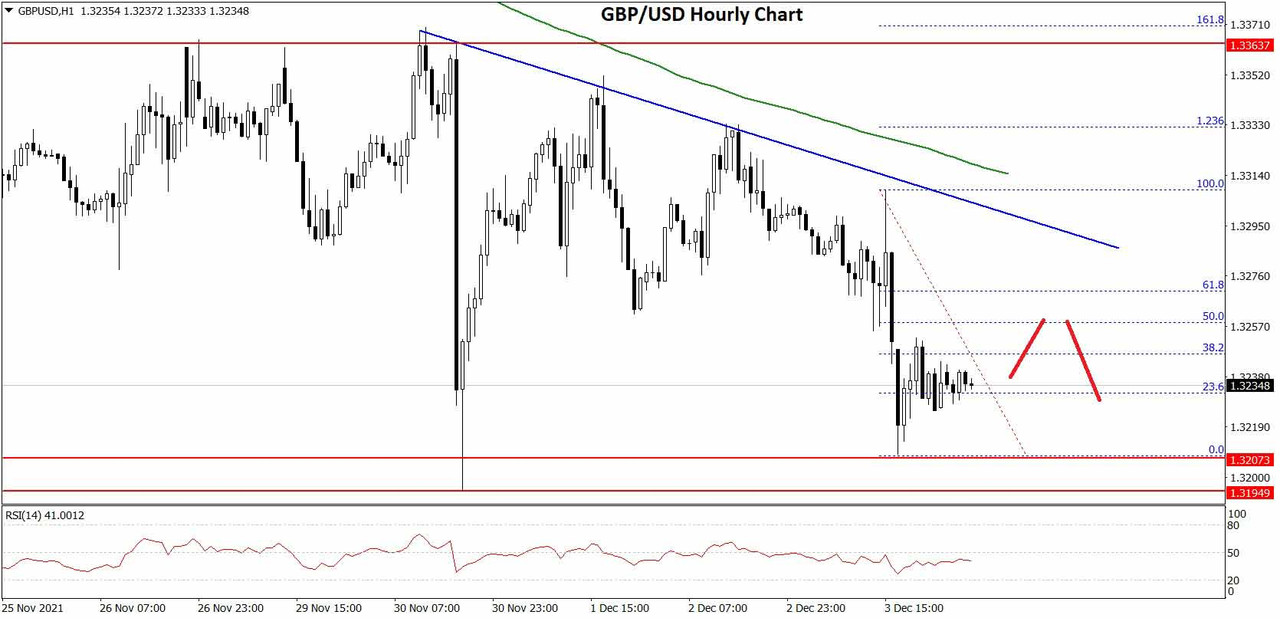
EUR/USD Hourly Chart
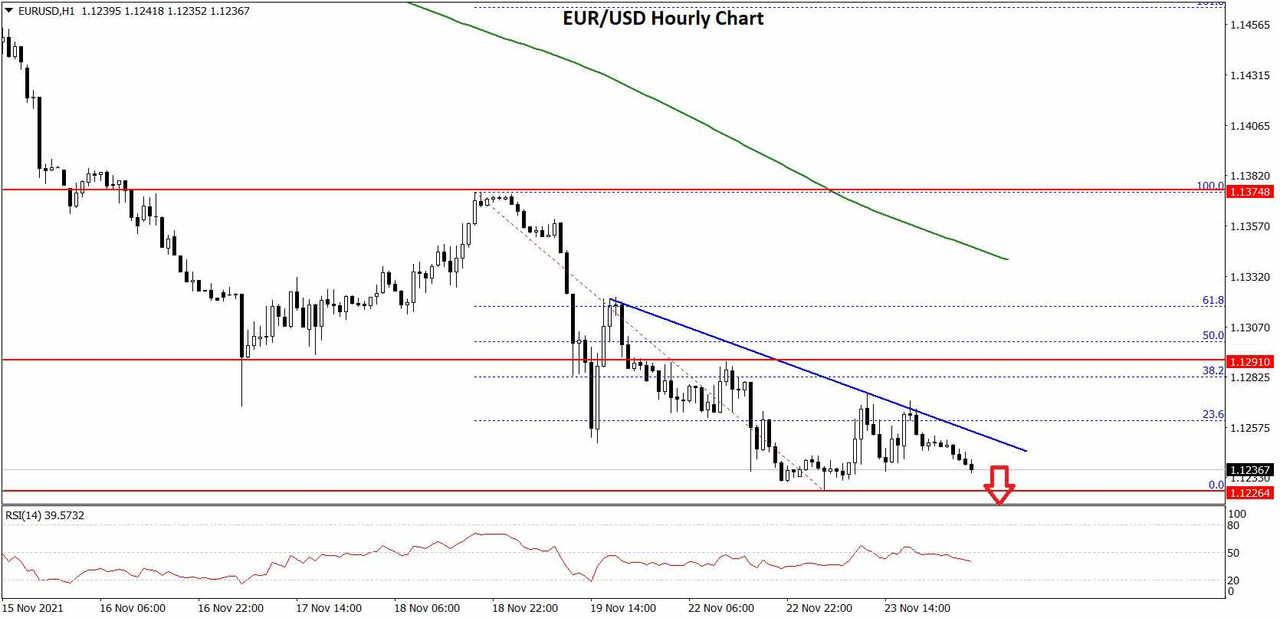
The pair is now consolidating losses near the 1.1230 level. On the upside, an initial resistance is near the 1.1255 level. The 23.6% Fib retracement level of the recent decline from the 1.1373 swing high to 1.1226 low is also near 1.1255.
There is also a key bearish trend line forming with resistance near 1.1255 on the hourly chart of EUR/USD. The next major resistance is near the 1.1300 zone.
The 50% Fib retracement level of the recent decline from the 1.1373 swing high to 1.1226 low is also near the 1.1300 zone. A clear upside break above the 1.1300 zone could open the doors for a steady move.
The next major resistance sits near the 1.1350 level. On the downside, an immediate support is near the 1.1225 level. The next major support is near the 1.1200 level.
A downside break below the 1.1200 support could start another decline. The next major support sits near 1.1120.
Read Full on FXOpen Company Blog...
EUR/USD started a fresh decline from well above the 1.1350 pivot zone. USD/CHF is rising, and it might extend gains above the 0.9350 level.
Important Takeaways for EUR/USD and USD/CHF
- The Euro failed to gain strength and declined below 1.1300 against the US Dollar.
- There is a key bearish trend line forming with resistance near 1.1255 on the hourly chart of EUR/USD.
- USD/CHF started a decent increase from the 0.9250 support zone.
- There is a connecting bullish trend line forming with support near 0.9310 on the hourly chart.
EUR/USD Technical Analysis
The Euro attempted an upside break above the 1.1400 resistance zone against the US Dollar. The EUR/USD pair failed to gain strength and started a fresh decline.
There was a clear break below the 1.1350 and 1.1300 support levels. The pair even broke the 1.1250 support and the 50 hourly simple moving average. Finally, there was a move below the 1.1230 level and a low is formed near 1.1226 on FXOpen.
EUR/USD Hourly Chart
The pair is now consolidating losses near the 1.1230 level. On the upside, an initial resistance is near the 1.1255 level. The 23.6% Fib retracement level of the recent decline from the 1.1373 swing high to 1.1226 low is also near 1.1255.
There is also a key bearish trend line forming with resistance near 1.1255 on the hourly chart of EUR/USD. The next major resistance is near the 1.1300 zone.
The 50% Fib retracement level of the recent decline from the 1.1373 swing high to 1.1226 low is also near the 1.1300 zone. A clear upside break above the 1.1300 zone could open the doors for a steady move.
The next major resistance sits near the 1.1350 level. On the downside, an immediate support is near the 1.1225 level. The next major support is near the 1.1200 level.
A downside break below the 1.1200 support could start another decline. The next major support sits near 1.1120.
Read Full on FXOpen Company Blog...