EURJPY daily technical analytics

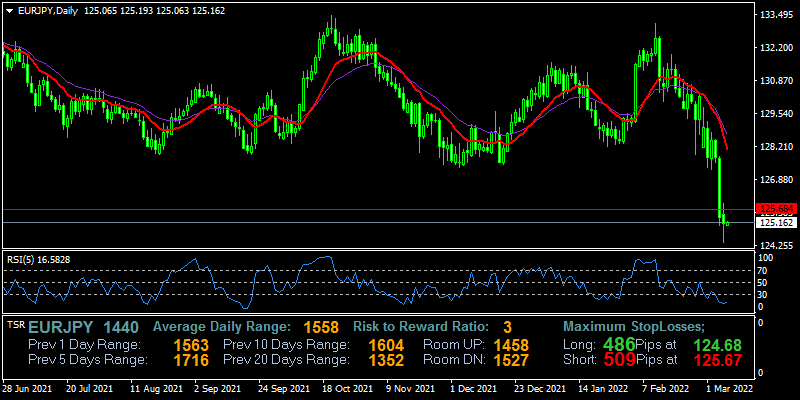
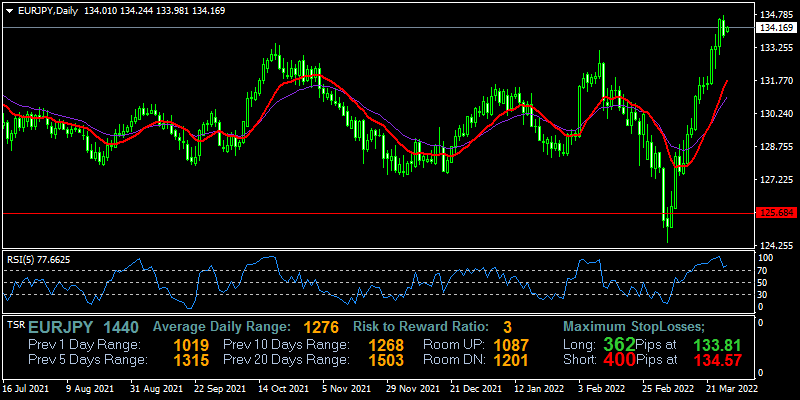
EURJPY yesterday market formed bearish candle, the price eventually drops to below previous opening price, although the candle not able to form new low, but the price still possible in a downtrend market.

Daily candlestick, RSI level now 29 means the price in oversold zone-based indicator, while the price below MA 12 and Mc Ginley indicator.

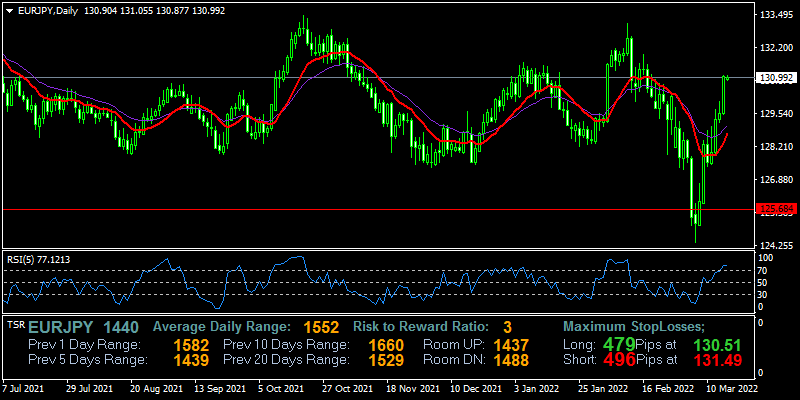
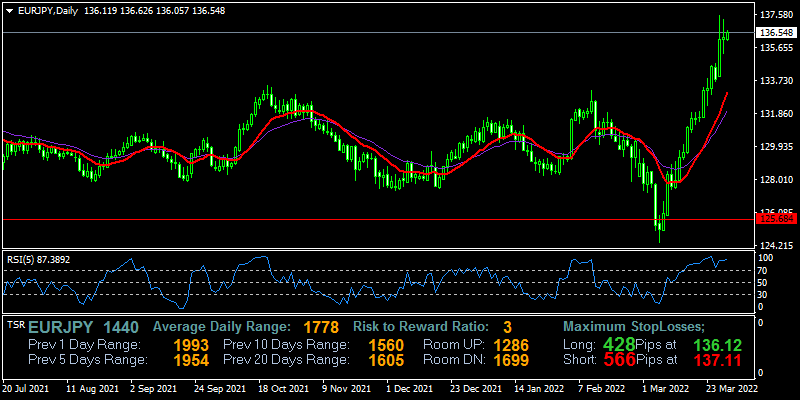
Now go to hourly, the price also still below MA 12 and Mc Ginley indicator, means the trend still bearish based indicator. while RSI 36 level, indicates a downtrend not yet entered oversold zone level.

Forex, CFDs are complex instruments and come with a high risk of losing
your money.

eurjpy-h1-fxopen-investments-inc.png
 
EURJPY drops sharply on the last week, JPY strengthening because this currency included safe-haven currency, amid war tension between Russia and Ukraine, leading many investors looking for safe-haven currency and commodity,

EUERJPY today, the price at 125.906, the pattern in consolidation after the price drops, based H4 indicator MA 12 the price now below MA line, while RSI level 11 indicated the price already enter oversold zone level based indicator.

While the H1 timeframe pattern candle tries to rebound, but still in weak volume trading, the price predicted continues to bearish in the long term. because not yet the price reach lower support based monthly timeframe

Forex, CFDs are complex instruments and come with a high risk of losing
your money.

eurjpy-h4-fxopen-investments-inc.png
 
Still, JPY strengthening to euro, the pair EURJPY continues to drop yesterday market, now price 125.126 in correction time, after dropped and formed a new low at 124.384, the price rebound and taking profit action brought the price move on 125.126,

Now in hourly, the price below moving average 12 line, but still in consolidation, RSI level now 46 indicates downtrend based indicator.

Forex, CFDs are complex instruments and come with a high risk of losing
your money.

eurjpy-d1-fxopen-investments-inc.png
 
EURJPY on yesterday market formed bulls candle after previous days on downtrend market, but the bullish candlestick formed can be two means, reversal pattern on the temporary retracement.

Now based daily timeframe the price is still below MA 12 line. means the downtrend still on the track-based indicator, while RSI level now 33 indicates price get out from oversold zone level.

Based hourly timeframe now the price above MA 12 line, means in short term the price in uptrend based indicator, while RSI level 47 indicates downtrend based indicator

Forex, CFDs are complex instruments and come with a high risk of losing
your money.

eurjpy-d1-fxopen-investments-inc.png
 
ERUJPY continues to bullish on yesterday's market, the pair success to formed new high and landing at 128.276 price level now, the bulls candle formed long body candle figures strong uptrend yesterday's market.

Daily timeframe now the RSI indicator shows 57 levels, means the trend on uptrend zone level, and the price already crosses Mc Ginley indicator, means possible to create a new trend, but the price still below MA 12 lines, means still need power to crosses MA line to change the trend based indicator.

H1 timeframe the price above MA 12 and Mc Ginley indicator, means uptrend in medium-term based indicator, RSI level 70 means the price on overbought zone level as warning reversal.

Forex, CFDs are complex instruments and come with a high risk of losing
your money.

eurjpy-d1-fxopen-investments-inc.png


Learning forex in a forum may ask anything.

Think of Many Things: Do ONE

D86dnp2.png


Get the Support for NEW Traders

Understand in Details and Get the Answers from the Experienced Forex Traders and FXOpen Forum Members.

Learn Forex Trading with FXOpen Forum

Forum-Buttonb.jpg
 
EURJPY rebound yesterday, after previous the bulls candle formed new high and crossing moving average, but in fact the price drops again, this is normal in the market when the trend move so high then will get pressure to retracement or reversal, take profit action to become one reason why the price drops.

Based daily now the price below MA 12 line means in downtrend based indicator, RSI level 51 means the price on uptrend zone level based indicator.

While in the hourly timeframe, the price below MA 12 lines indicates a downtrend on this timeframe, and RSI level 47 means the current trend is a downtrend-based indicator level.

Now price 127.662 formed bulls candle on the last time analysis.

Forex, CFDs are complex instruments and come with a high risk of losing
your money.

eurjpy-d1-fxopen-investments-inc.png
 
Monday morning has started, the current price EURJPY 128.331, it already rises from opening price 127.979, seems the price try to head up to resistance level 128.984.

Daily timeframe shows the price now still below the MA 12 line, but the candle formed bulls candle, while according to Mc Ginley indicator, the price now already above the line, means-based indicator the signal uptrend, RSI level 59 indicates uptrend based indicator level, and not yet enter the overbought level zone.

The hourly timeframe of the current last candle formed long bulls body candle, and the price already crosses MA 12 and Mc Ginley indicator means signal uptrend based indicator already appear, while RSI level 71, means the price already on overbought zone level based indicator.

Forex, CFDs are complex instruments and come with a high risk of losing
your money.

eurjpy-d1-fxopen-investments-inc.png
 
EURJPY today, the current price is 129.400, its already formed bulls candle where the price success to formed new high than the previous high, means the uptrend occurs on recent movement,

Based daily timeframe now the price already crosses the MA 12 line and the MC Ginley line indicator means the trend more uptrend based indicator
RSI level now 67 indicates uptrend not yet enter overbought zone level based indicator but already close the overbought level 70.

Move to hourly timeframe, the currency price above MA 12 line and Mc Ginley indicator line, means the uptrend based indicator, RSI level 66 in this timeframe, indicates uptrend not yet enter overbought zone level.

Forex, CFDs are complex instruments and come with a high risk of losing
your money.

eurjpy-d1-fxopen-investments-inc.png


Support new trader on forum

A Goal is a Dream with a Deadline

Dream.png


Basic steps for a newbie Forex trader

Understand in Details and Get the Answers from the Experienced Forex Traders and FXOpen Forum Members.

Learn Forex Trading with FXOpen Forum

Forum-Buttonb.jpg
 
EURJPY today price 129.705, the candlestick formed bulls candle yesterday, and figure lower high than means the pattern still uptrend market condition.

The price above indicator moving average and Mc Ginley, based on the theory the current trend is uptrend market, while RSI level in daily timeframe now 69 already close to overbought level zone-based indicator.

While on the hourly chart, the current price above MA 12 and Mc Ginley indicator, means the trend still uptrend based indicator, and RSI level 61 sloping down, its tries to down but still on bullish zone level

Forex, CFDs are complex instruments and come with a high risk of losing
your money.

eurjpy-d1-fxopen-investments-inc.png


Get inspired from interview the third winner contest in FTC 2021

[media]
 
Last edited:
EURJPY price today 130.982 based FXOpen trading platform mt4, the price still face trend continuation, its formed long body candles occurred yesterday market, means the volume trading is higher than before

Now we can see on the daily timeframe, the price above MA 12 and Mc Ginley line indicator, means uptrend move strongly because distance prce and the line is very far, but RSI level now 76, means-based indicator already enter overbought zone level, this is a warning by indicator for possible reverse

While on hourly timeframe, the price above MA 12 and Mc Ginley line indicators, means uptrend based indicator, RSI level 70, means the price in overbought zone level based indicator, this is warning for possible reversion

Forex, CFDs are complex instruments and come with a high risk of losing
your money.

eurjpy-d1-fxopen-investments-inc.png
 
EURJPY price today 131.509, the trend still continues to bullishness on yesterday market, the price success to breaking high and formed new high, 131.900 is yesterday's high.

Although yesterday's market RSI level already show overbought zone level, the fact the price still rises and is possible to reach the next resistance, 133.xxx,, this is proven if no perfect indicator included RSI, now based on daily timeframe the level RSI show 80, maybe if reach level above 90 levels the warning is strong, because possible price reached resistance zone level already.

In the hourly timeframe now the price above MA 12 and Mc Ginley indicator, means the uptrend is still on the way based on indicator theory, while RSI level 46 is based theory under downtrend level.

Forex, CFDs are complex instruments and come with a high risk of losing
your money.
eurjpy-d1-fxopen-investments-inc.png
 
EURJPY today price 131.172, based trading platform FXOpen, there are no gap occurs on this Monday morning, the candle pattern look still formed bullishness formation, but RSI giving warning if the price already enter in overbought zone level on a daily timeframe

In March the trading pair EURJPY had tendencies to a formed a bullish trend, the trading pair formed a swing low to swing high with a distance of more than 7000 pips based five-digit decimal quote,

Currently, the price is still moving on high but has not yet broken the high, Monday market, maybe the market needs to wait increase volume to push the price even higher.

The hourly timeframe the price above MA 12 indicates bullish trend based indicator, and RSI levels 61 means the market uptrend based indicator

Forex, CFDs are complex instruments and come with a high risk of losing
your money.

eurjpy-d1-fxopen-investments-inc.png
 
EURJPY moves on the consolidation phase, although on Friday the bullishness dominates the market, but on Monday trading, the market volume is so weak, the price move on the previous range prices. Now price 131.675, it on a previous high area not yet breakout.

In the daily timeframe, the price above MA 12 and Mc Ginley indicator, means the current trend is an uptrend, RSI level now 81 already enter overbought zone level, based indicator theory possible to reversal.

While based on hourly timeframe now the price is flat, this is often occurring on Asian session market where volume trading is low, so volatility price also low. RSI level now 42 indicates a downtrend-based indicator.

Forex, CFDs are complex instruments and come with a high risk of losing
your money.

eurjpy-d1-fxopen-investments-inc.png
 
EURJPY move even higher yesterday, although RSI shows overbought zone level, but in fact, the price success to break high and formed new high, now price 133.624 based MT4 trading platform FXOpen. the next possible resistance at high 134.000.

Daily timeframe shows long body bullish candle occurs that means the volume trading is high and successful making the price moving very large pips distance. the price is far away from MA 12 but the RSI level shows 89 levels, based theory already entered overbought zone level, but has not yet reached 100

In the hourly timeframe the price above MA 12 and Mc Ginley indicator, based indicator uptrend is strong, and RSI level 77 means the dominant market currently s bullishness.

Forex, CFDs are complex instruments and come with a high risk of losing
your money.

eurjpy-d1-fxopen-investments-inc.png
 
EURJPY today price 133.342, the price face consolidation after soaring and formed new high, the buyer pressure get weak and many take profit action may lead price then on correction, in entirely candle formed small body and long shadow on top and bottom, its means the buyer and seller in balance.

Daily timeframe the price level still above MA 12 and Mc ginley indicator as bullish trend based theory, while RSI level 89 in overbought zone level based indicator.

Go to hourly, the history price tell if its break MA 12 and Mc Ginley indicator from top, but now the price already above MA 12 and mc ginley indicator, means bullish based indictor, while RSI level 66, indicates uptrend based indicator.

Forex, CFDs are complex instruments and come with a high risk of losing
your money

eurjpy-d1-fxopen-investments-inc.png
 
EURJPY success to break high and forming new high in yesterday's market, after correction times ended then the price soared to 134.668 based on MT4 platform FXOpen, although yesterday's RSI level showed an overbought zone level, the strong uptrend cant stoped.

On daily timeframe now candle moves far away from MA 12 and Mc Ginley indicator, which means the trend is strong, RSI level 92 indicates price on overbought zone level based indicator.

Go to the hourly timeframe the price above MA 12 and Mc Ginley indicator, means uptrend based short term, but based RSI now get alert because the level already on 95, this is overbought zone level based indicator, however the market move because of demand and supply.

Forex, CFDs are complex instruments and come with a high risk of losing
your money

eurjpy-d1-fxopen-investments-inc.png


FXOpen is a global forex and CFD broker, with a network of worldwide brokerages regulated by the FCA, CySEC and ASIC. FXOpen offers ECN, STP, Micro and Crypto trading accounts (dependent on entity).
 
EURJPY current price 134.172, on this Monday morning, there is not gap occurs on this pair, the prcice looks normal, when on Thursday the price move and formed new high, but the Friday market, occurs retrace, the price drops and formed bears candle, but not reached the low price then bounce to up.

On the daily timeframe, the candles are still above MA 12 and Mc Ginley indicator, which means the trend is still an uptrend-based indicator, while the RSI level actually already shows an overbought zone level since few days past, now level 77, still in overbought zone level based indicator.

Moves to hourly timeframe, the current price still crinkle on MA line, in short term analysis the flat or sideways market on this pair, but in a small wave, the price tries to crossing up the line

Forex, CFDs are complex instruments and come with a high risk of losing
your money

eurjpy-d1-fxopen-investments-inc.png

FXOpen is a global forex and CFD broker, with a network of worldwide brokerages regulated by the FCA, CySEC, and ASIC. FXOpen offers ECN, STP, Micro, and Crypto trading accounts (dependent on the entity).
 
EURJPY price today 136.052, the price success to break high and formed new high on yesterday market, long body candles indicates strong bullish occurs on beginning days on this week. But the price formed high 137.523 then there are seller pressure dragged the price drop as a correction phase to the current price level.

Daily timeframe still shows the price above MA 12 line and Mc Ginley indicator asn strong bullish market occurs, RSI level 83 indicates overbought based indicator.

In short-term analysis hourly timeframe, the price now above MA 12 means uptrend based indicator, while RSI level 50 indicates indecision trend based indicator.

Forex, CFDs are complex instruments and come with a high risk of losing
your money

eurjpy-d1-fxopen-investments-inc.png

FXOpen is a global forex and CFD broker, with a network of worldwide brokerages regulated by the FCA, CySEC, and ASIC. FXOpen offers ECN, STP, Micro, and Crypto trading accounts (dependent on the entity).[/img]
 
EURJPY today price 136.567 at the time of writing, the opening price 136.119, means the price already moving up and form bulls candle right now. But the candle is still very small and the high has not yet broken the previous high, overall the price still move to previous range prices.

Daily timeframe still above MA 12 and Mc Ginley indicator with sharp sloping up, the uptrend strong starting since 8 March and now the date close to end month, RSI level 87 indicates overbought based indicator, this is zone level already few days past in overbought zone but the price still continues bullish.

Hourly timeframe the price above MA 12 and Mc Ginleyt indicator means uptrend based indicator, while RSI level 72 in theory already enter overbought zone level.

Forex, CFDs are complex instruments and come with a high risk of losing
your money

eurjpy-d1-fxopen-investments-inc.png

FXOpen is a global forex and CFD broker, with a network of worldwide brokerages regulated by the FCA, CySEC, and ASIC. FXOpen offers ECN, STP, Micro, and Crypto trading accounts (dependent on the entity).
 
EURJPY today price 136.085, the price still hard to break the high, and tend to move on the previous range daily, but the price tries to form new low 134.871, but then get pressure from buyer and land to the current price level, candle formation high lower than previous high indicates reversal pattern-based candlestick.

Daily timeframe now the price still above MA 12 and Mc Ginley indicators, based indicator still an uptrend, and RSI level now 80 means already in overbought zone level based indicator,

Go to hourly timeframe, the price above MA 12 and Mc Ginley indicator mean uptrend based indicator at a shorter time, body candles small indicates the low trading volume in session market, RSI level 69 indicates uptrend close to overbought zone level.

Forex, CFDs are complex instruments and come with a high risk of losing
your money

eurjpy-d1-fxopen-investments-inc.png

FXOpen is a global forex and CFD broker, with a network of worldwide brokerages regulated by the FCA, CySEC, and ASIC. FXOpen offers ECN, STP, Micro, and Crypto trading accounts (dependent on the entity).
 
Back
Top Bottom