EURJPY daily technical analytics

EURJPY today price 134.850, the price yesterday formed bears candle and shaped new low, but currently, the price try to shut up from hourly timeframe.

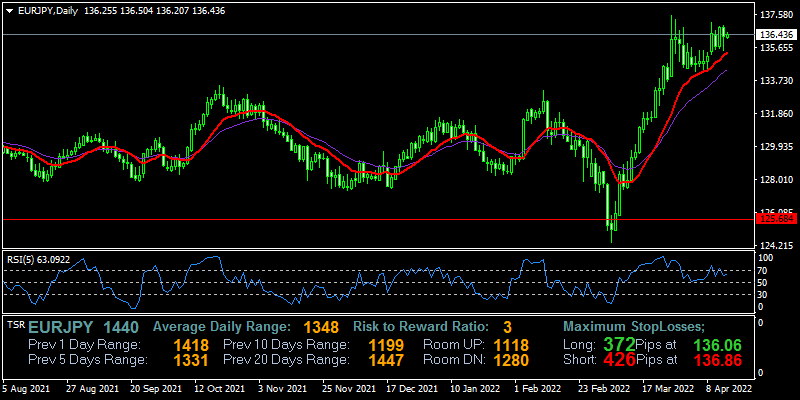
Daily timeframe, the price above MA 12 and Mc Ginley indicators indicate if the trend bullish based indicator, while RSI level 58 indicates uptrend based indicator.

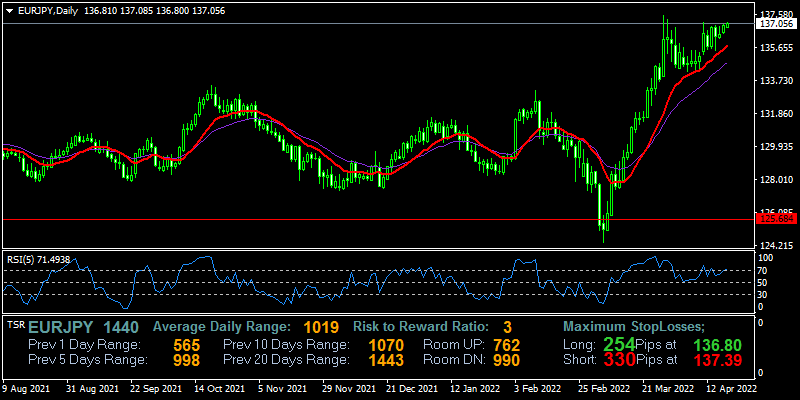
Move to short-term trading analysis in the hourly timeframe, the current price trying to cross MA 12 from the bottom line, but still below the line, its has already broken Mc Ginley line indicator as a reversal signal based indicator. while RSI level 65 indicates an uptrend market not yet entered an overbought level.

Forex, CFDs are complex instruments and come with a high risk of losing
your money

eurjpy-d1-fxopen-investments-inc.png

FXOpen is a global forex and CFD broker, with a network of worldwide brokerages regulated by the FCA, CySEC, and ASIC. FXOpen offers ECN, STP, Micro, and Crypto trading accounts (dependent on the entity).
 
EURJPY price today 135.439, the price on the daily timeframe, there are reversal pattern that occurs, the high lower than the previous high, but now in a small timeframe, the price trying to push uptrend but in a small volume.

Daily timeframe shows the price above MA 12 line and RSI level now 64 means in uptrend based indicator, while the price still moves inside bar candle bullish, not yet confirmed breakout at the moment.

In the hourly timeframe the price trying to cross MA 12 line from bottom to the top, the market condition is still sideways now and candle flat. while based on RSI level now 56 indicated uptrend based indicator in short term trading analysis.

Forex, CFDs are complex instruments and come with a high risk of losing
your money

eurjpy-d1-fxopen-investments-inc.png

FXOpen is a global forex and CFD broker, with a network of worldwide brokerages regulated by the FCA, CySEC, and ASIC. FXOpen offers ECN, STP, Micro, and Crypto trading accounts (dependent on the entity).
 
EURJPY's current price is 134.697, yesterday market of the pair formed a bear candle and landed near at previous low, now the price in consolidation based on the hourly timeframe.

From the big picture in the daily timeframe, the price is still above MA 12 line, but we can see the MA line start to be flat, it is possible as a reversal pattern on long-term technical analysis, while RSI level 52 indicates an uptrend still on the level based indicator.

Go to the hourly timeframe as a short term analysis, now the price below MA 12 line but the MA line starts to form flat, RSI level 40 indicates downtrend based indicator.

Forex, CFDs are complex instruments and come with a high risk of losing
your money

eurjpy-d1-fxopen-investments-inc.png

FXOpen is a global forex and CFD broker, with a network of worldwide brokerages regulated by the FCA, CySEC, and ASIC. FXOpen offers ECN, STP, Micro, and Crypto trading accounts (dependent on the entity).
 
EURJPY today price 134.772, the price drops yesterday and formed bears candle but there are equilibrium candle formed means buyer and seller still trying to fight, the low zone level not yet breakout but the reversal pattern perfectly formed

Daily timeframe now shows the price above MA 12 line, which means still uptrend but the line starting to flat means there are a possibility to reversal after uptrend long period of time, RSI level 54 level means still uptrend based indicator

Hourly timeframe, the price still in slow movement and indecision market, where the price still move on MA 12 line, while RSI level 51 weighted to uptrend based indicator

Forex, CFDs are complex instruments and come with a high risk of losing
your money
eurjpy-d1-fxopen-investments-inc.png

FXOpen is a global forex and CFD broker, with a network of worldwide brokerages regulated by the FCA, CySEC, and ASIC. FXOpen offers ECN, STP, Micro, and Crypto trading accounts (dependent on the entity).
 
EURJPY today price 135.016, we can see if yesterday market formed bullish candle, although the reversal pattern occurs on the daily timeframe, the price still face rejection on lower zone level 134.300.

Daily timeframe now the price still above MA 12 line and MC Ginley indicator, although the line starting to flat, the price still hard to break support daily, RSI level 58 still indicated uptrend based indicator.

Go to the hourly timeframe as short-term technical analysis, the price below MA 12 line but trying to cross up the line, while RSI level 53 indicates uptrend based indicator.

Forex, CFDs are complex instruments and come with a high risk of losing
your money

eurjpy-d1-fxopen-investments-inc.png

FXOpen is a global forex and CFD broker, with a network of worldwide brokerages regulated by the FCA, CySEC, and ASIC. FXOpen offers ECN, STP, Micro, and Crypto trading accounts (dependent on the entity).
 
EURJPY price today 134.927. The market is considered a consolidation phase, where the price move on the previous daily range, yesterday market, EURJPY formed a high of 135.491, but the price gets a rejection at this level and makes the price back to drop on the middle candle.

Daily timeframe now the price still above Mc Ginley and Moving average 12 indicators, where Mc Ginley indicator giving fast response than MA 12, the line start to flat on this consolidation. While based on RSI level 57 indicates an uptrend-based indicator.

In H1 timeframe, the price tried to cross Mc Ginley indicator and the Moving average 12 indicator from bottom to top, but the next candle there are sell pressure and make the price still undecided the trend, RSI level 52 indicates an uptrend almost in neutral market.

Forex, CFDs are complex instruments and come with a high risk of losing
your money

eurjpy-d1-fxopen-investments-inc.png

FXOpen is a global forex and CFD broker, with a network of worldwide brokerages regulated by the FCA, CySEC, and ASIC. FXOpen offers ECN, STP, Micro, and Crypto trading accounts (dependent on the entity).
 
Actually, I felt strange about this thread, because I remember yesterday submitting my analysis here on the thread, but why I see the last update is on Friday, I will try again and make sure if this post will vanish.

EURJPY today price 136.712 based FXOpen trading platform, the price formed bulls candle yesterday after previous day decline, now the price already on high zone-based daily candle history.

Daily timeframe show the price above Mc Ginley indicator and MA 12 line indicator, means uptrend based indicator where Mg Ginley line above MA 12 line, while RSI level 70 means the price already on overbought zone level based indicator.

Hourly price movement, Mc Ginley line crosses MA 12 line from bottom to the top means uptrend signal by indicator, the price above indicator line, while RSI level 60 indicates uptrend not yet enter overbought zone level.

Forex, CFDs are complex instruments and come with a high risk of losing
your money

eurjpy-d1-fxopen-investments-inc.png
 
EURJPY today price 136.497, the price still move on previous range market, the price gets a rejection on the high 136.925 and move to formed bearish candle yesterday

Daily timeframe the price above MA 12 and Mc Ginley indicator means the trend still tend to shape bullish based indicator, while based on RSI as indicator oscillator the price now at level 63 RSI level means uptrend based indicator.

Short-term analysis on hourly timeframe, the current price formed bulls candle, and the price above MA 12 and Mc Ginley indicator means the trend is a bullish based indicator, while RSI level now 71 level means the price enter in overbought zone level based indicator.

Forex, CFDs are complex instruments and come with a high risk of losing
your money

eurjpy-d1-fxopen-investments-inc.png
 
EURJPY today price 136.916, there is no gap occurs on this morning, but the price gonna rise and reach previous high already.

Based timeframe daily, the price is now above MA 12 line and the Mc Ginley indicator means that based both indicators the current trend is an uptrend, whereas the Mc Ginley line above MA 12 indicates a strong trend, while the RSI level show 69 levels already closest overbought zone level based indicator.

Timeframe hourly, the price action formed one large candle on this timeframe, where the price already crosses MA 12 and Mc Ginley indicator as uptrend signal on the short term, the possible resistance 137.098 as previous high based history, while RSI level on the timeframe show 73 level means the price already on an overbought zone level.

Forex, CFDs are complex instruments and come with a high risk of losing
your money

eurjpy-d1-fxopen-investments-inc.png
 
EURJPY today price 137.070, the pair still formed bulls pattern, yesterday movement still on low trading volume, and not yet break high.

Timeframe daily still shows the price above MA 12 and Mc Ginley indicators, which means uptrend market-based indicator, while RSI level 71 indicates the price enter overbought zone level.

Timeframe hourly as short term technical analysis, the current price above MA 12 and Mc Ginley indicator where Mc line above MA line indicates current trend quite strong. but based RSI level now 85 indicates an overbought zone level based indicator.

Forex, CFDs are complex instruments and come with a high risk of losing
your money

eurjpy-d1-fxopen-investments-inc.png
 
EURJPY today price 139.400 on FXOpen trading platform, the price success to break high and formed long body candles as mark the strong uptrend on yesterday market.

Timeframe daily now the price leaving Mc Ginley line and MA 12 line far away above the line, after break the price level 137, the price of EURJPY soaring high, RSI level now 86 indicates the price enter on overbought zone level based indicator, this would be attention for possibility of reversal time due to the price already run very high.

Timeframe hourly, now the pattern still formed bullish market, where the price above MA 12 and Mc Ginley indicator, while RSI level 72 indicates the price enter overbought zone level based indicator, although not yet confirmed by candle pattern.

Forex, CFDs are complex instruments and come with a high risk of losing
your money

eurjpy-d1-fxopen-investments-inc.png
 
EURJPY today's price soaring to continue bullish, now price 139.563, the price success to break previous high and reach a new high.

The monthly timeframe show for two months the price tends to be bullish and may continue, on the daily timeframe now the price is still above MA 12 line and Mc Ginley indicator indicates an uptrend-based indicator, and RSI level 84 indicates an overbought zone level based indicator.

Timeframe hourly, two candles formed bullish pattern after consolidation, the price now above MA 12 and Mc Ginley indicator means uptrend based indicator, while RSI level show level 87 as overbought zone level based indicator.

Forex, CFDs are complex instruments and come with a high risk of losing
your money

eurjpy-d1-fxopen-investments-inc.png
 
EURJPY today price 139.034. The price move in the consolidation phase after on previous days formed bullish strong. yesterday formed high 139.994 based FXOpen trading platform, and then the price gets pressure from the seller and makes the price fall to the current price.

Timeframe daily the price show still above Mc Ginley and MA 12 with MA line below Mc Ginley line, based on both indicator still on uptrend market, while RSI level 80 indicates the price in overbought zone level based indicator where OB level is 70.

Timeframe hourly as short term analysis shows the price now crosses Mc Ginley and MA 12 indicator line, from top to bottom line with Mc Ginley line start to crosses MA 12 line indicates reversal bearish based indicator, while RSI level 29 indicates the price in oversold zone level based indicator where the level OS is 30.

Forex, CFDs are complex instruments and come with a high risk of losing
your money

eurjpy-d1-fxopen-investments-inc.png
 
EURJPY today price 139.128, there is no gaps can be seen on this morning, low timeframe looks normal price chart pattern. On high timeframe still formed a bullish market, but after several days the price moved on the range. should beware of the reversal patterns due to the price already on a high zone level.

Timeframe daily, still price move above Mc Ginley and MA 12 indicator, the means-based indicator still an uptrend, while Mc Ginley line above MA line acts as possible dynamic support, RSI level 75 indicates the price enter in overbought zone level based indicator.

Timeframe hourly, the price already crosses MA 12 and Mc Ginley indicator, uptrend pattern-based indicator, RSI level 66 still trying to enter overbought zone level on this timeframe.

Forex, CFDs are complex instruments and come with a high risk of losing
your money

eurjpy-d1-fxopen-investments-inc.png
 
EURJPY today price 137.117. The price eventually drops and formed a low of 136.475. The price now crosses the Mc Ginley indicator but has not yet touched MA 12 line.

Timeframe daily, the price trying to crosses Mc Ginley line indicator, and MA 12 position line still above Mc Ginley line indicator, means still in uptrend based indicator, but should to careful, due yesterday drops is large pips, still possible the price push to down. RSI level 41 indicates a downtrend-based indicator.

Timeframe hourly, the price bounce after touched Mc Ginley indicator line, and the price below MA 12 with MA line above Mc Ginley line mean downtrend based indicator. RSI level 40 indicates a downtrend-based indicator.

Forex, CFDs are complex instruments and come with a high risk of losing
your money

eurjpy-d1-fxopen-investments-inc.png
 
EURJPY today price 135.334, the trend still continues to bearish on yesterday market.

On timeframe daily, the price success to break MC Ginley indicator, then continue to break MA 12 line, now price below MA line and Mc Ginley line indicator, means downtrend based indicator, but there is not yet confirmed by crossing line because Mc Ginley line still above MA line. RSI level 28 a warning the price has already entered an oversold zone level-based indicator.

On timeframe hourly as short term trading analysis, the price now below MC Ginley and MA 12 line, with position line Mc Ginley below MA line, indicates downtrend confirmed. RSI level 34 trying to get out from the oversold zone.

Forex, CFDs are complex instruments and come with a high risk of losing
your money

eurjpy-d1-fxopen-investments-inc.png
 
EURJPY today price 136.619, the price now in a consolidation phase, the price trying to head up but still in low trading volume.

Timeframe daily, the price trying to cross MA 12 from bottom line to up, but there are rejection on the line, price now below MA 12 and Mc Ginley indicator, while the Mc Ginley line starts to slope down, RSI level 32 already out from oversold zone level.

Timeframe hourly, the price crosses MA line and Mc Ginley line, now above the line indicates uptrend based indicator, while RSI level 62 indicates uptrend not yet enter overbought zone level.

Forex, CFDs are complex instruments and come with a high risk of losing
your money

eurjpy-d1-fxopen-investments-inc.png
 
EURJPY today price 137.333, the price bounce already after the previous price drops quietly sharply.

On timeframe daily, the price success to crosses MA 12 line and Mc Ginley indicator line, current position Mc Ginley line above MA 12 line indicates uptrend based formation, RSI level 54 indicates uptrend based indicator.

Timeframe hourly, the price move on Mc Ginley line indicator, its try to crosses the line but still hard, due to lower volume, while MA 12 line below the price indicates uptrend based indicator, RSI level 43 indicates downtrend based indicator.

Forex, CFDs are complex instruments and come with a high risk of losing
your money

eurjpy-d1-fxopen-investments-inc.png
 
EURJPY still moving in a consolidation phase, the price is now above the Mc Ginley indicator and MA 12 indicator, which means an uptrend-based indicator.

The current price is 136.994 based FXOpen trading platform, the price trying to head up but still get a rejection on the high-level previous candle,

On timeframe daily, based MA line in uptrend market because the price above the line, while RSI level 51, close to a neutral position.

On the hourly timeframe, the price below MA 12 and Mc Ginley indicator line, but candlestick formed bulls candle trying to crosses the line, now position Mc Ginley line trying to crosses MA 12 from top to the bottom, but not yet confirmed by candle pattern, RSI level 54 indicates uptrend based indciator.

Forex, CFDs are complex instruments and come with a high risk of losing
your money
eurjpy-d1-fxopen-investments-inc.png
 
EURJPY today price 136.745 based FXOpen trading platform, the price trying to head up but still faced rejection yesterday.

On timeframe daily, the price formed bears candle, on Monday market. low trading volume can't lead the price to break low, based on MA 12 now the price above the line indicates an uptrend market-based indicator, while based Mc Ginley indicator is still in a neutral trend because the price still moves below and above the line to criss-cross, RSI level 47 indicates downtrend but still tend to neutral trend zone.

On the hourly timeframe, the price is now below MA 12, and the Mc Ginley indicator line indicates a downtrend but still on low trading volume, RSI level 45 indicates a downtrend-based indicator.

Forex, CFDs are complex instruments and come with a high risk of losing
your money

eurjpy-d1-fxopen-investments-inc.png
 
Back
Top Bottom