EURJPY daily technical analytics

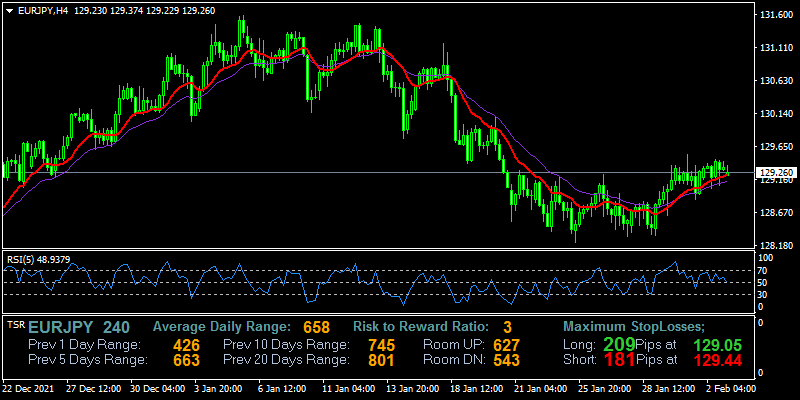
The market pattern still figures out the bullish pattern on the hand, the price not yet hit previous high 133.000, if look history price, it's very similar pattern occurs, although RSI now enters on the overbought level at 73, the pattern still strong bullish, but possible in the near term, may occur correction before continuing the trend.

H1 the current price above MA line, its bullish signal, meanwhile RSI level 52, indicates bullish on higher dominated at the current time.

Forex trading is risky, do your own risk
eurjpy-d1-fxopen-investments-inc.png
 
Yesterday price drops on EURJPY, its formed bearish candle, but the price still above MA line, indicates as bullish still on hand, meanwhile, go to the H4 timeframe, we get a different view where the pattern bullish move like as wavy, where the MA line works as dynamic support and the safe position to enter is at support zone, but of course, still need to keep trading using a stop loss.

RSI level 43 at the H4 timeframe indicates starting buy signal
Price below the MA line indicates a downtrend.

Forex trading is risky, do your own risk
eurjpy-h4-fxopen-investments-inc.png
 
Last week the trading pair EURJPY rise and land to high again, now on this morning the price occurs gap where the opening prce below the closing price, and usually when occurs gap then the price will move to cover the gap, now the gap already covered and possible the price will move like usual,

H1 timeframe, the price above MA line, indicates as an uptrend, meanwhile, RSI level 63 indicates uptrend not yet entered the overbought zone.

Forex trading is risky, do your own risk
eurjpy-d1-fxopen-investments-inc.png
 
The price of EURJPY suddenly drops yesterday, its formed a new low on the daily timeframe, now the price has already touches the MA line that acts as dynamic support, let see what happens later, RSI level 49 trying to cross line above 50 RSI level.

On the other side from the H1 timeframe, the price is below the MA line, but the candle pattern formed a reversal pattern, meanwhile RSI level 59 indicates uptrend market condition, based on the weekly timeframe it possible reversal pattern for the long term, but correction maybe occur today on EURJPY trading pair.

Forex trading is risky, do your own risk
eurjpy-d1-fxopen-investments-inc.png
 
The price now already lands at the high zone level based on the daily timeframe, looking candle formation the pattern reversal is possible to downtrend on the long term because the high cant exceeds previous high and formed triangle pattern.

Now based on H1 the price above the MA line indicates an uptrend, and RSI level 63, still indicates an uptrend, but based on price history, this zone is a resistance zone, reversal maybe occur on short term

Forex trading is risky, do your own risk
eurjpy-d1-fxopen-investments-inc.png
 
EURJPY trading pair still move on bulls market, but yesterday there is a seller trying to push the price down, and make close price near to open price. Based moving average indicator, the trend still formed in an uptrend because of the price was above the MA line. meanwhile, the RSI value is 60, it has not yet been entered on an overbought zone-based indicator.

Go to hourly timeframe, we can see if the price already crossing up the MA line indicates if uptrend on the hand, meanwhile RSI value also 60 indicates not yet entered overbought zone price-based indicator, the conclusion the price maybe continue bullish,

Forex trading is risky, do your own risk
eurjpy-d1-fxopen-investments-inc.png
 
EURJPY again formed downside movement yesterday, after before the price reach on daily high, now the price formed new wave on the low. based on the h4 timeframe, now the pattern is a good time to buy, with stop loss below the line.

RSI level 36 steep up, candle pattern in support zone, but on H1, the price still in consolidation, its formed price move on a small range based hourly, and trading pair is very dynamic.

Forex trading is risky, do your own risk
eurjpy-h4-fxopen-investments-inc.png
 
The price drops on Friday market, and now the price land 130.402 and formed long-tail candle on daily, gap occurs on this pair where the open price very far different from a close previous candle on M15 timeframe.

Now the price above MA 12 on daily candle, meanwhile based Mc Ginley Indicator this still in a downtrend, and go to H1 timeframe the price crossed up Mc Ginley and MA 12, with RSI value 63.

Forex trading is risky, do your own risk
eurjpy-d1-fxopen-investments-inc.png
 
Now the price above MA line and Mc Ginley indicator based daily timeframe, the price formed bull candle but in small body yesterday market, RSI ; level 51 in medium level, which more weighted to an uptrend.

H1 timeframe the price above MA and Mc Ginley indicator, meanwhile RSI value 52 as weighted to uptrend, but is exactly the price will go up? market forex is dynamic, the indicator only helps tool and is not always perfect, so take risk limit in each plan trading.

Forex trading is risky, do your own risk
eurjpy-d1-fxopen-investments-inc.png
 
And the price is drops yesterday and formed bears candle with a long body size, now the price is already on support zone based on history price based H4 timeframe, RSI indicator already at level 26 as an oversold zone.

In the H1 timeframe the price starts to weak, the pattern formed correction time and possible the reversal occurs on the next, the reason is price already on oversold, and formed in the bottom line as a support zone, keep use risk management because the market is dynamic.

Forex trading is risky, do your own risk
eurjpy-h4-fxopen-investments-inc.png
 
Its formed a new high and shaped bulls candle now, but the price still below the MA line and Mc Ginley indicator line, weighted downtrend still possible on the way, meanwhile RSI value 41 sloping up.

Go to H1 timeframe the price already above MA line and Mc Ginley line indicator, its uptrend formation, sometimes wave price from small timeframe become trigger major trend, but RSI now already on level overbought at 76 based theory the price will reverse.

Forex trading is risky, do your own risk
eurjpy-d1-fxopen-investments-inc.png
 
The price eventually drops and continue to decline, the price success to formed long body candle bearish, but now based on RSI level this is already entered in the oversold zone, this is possible the pair move as a retracement and leading RSI out to oversold zone before continuing the trend, meanwhile, support zone still far from the current price.

Go to H1, the price pattern is still on downtrend wave, the price still below MA line and Mc Ginley line indicator, but RSI level already enter oversold value 2, based theory this is an alert for possible reversal because the seller already saturated.

Forex trading is risky, do your own risk
eurjpy-d1-fxopen-investments-inc.png
 
Candle formation still in a downtrend market, but on the last week on Friday market, the price move high volatile and formed like as Doji candle, meanwhile based on RSI now at level oversold value 22, if draw line there is divergence signal for the trading pair

Forex trading is risky, do your own risk
eurjpy-d1-fxopen-investments-inc.png
 
The price-moving bulls market on yesterday trading, the price able to form new high, RSI line already out from the overbought level zone at level 31 and the line formed steeping up to cross crucial line oversold zone level.

Although in daily timeframe MA line still above the price that means still in a downtrend market, using H1 timeframe now the price above MA line as indicates bullish formation trend, the RSI line already enters on an overbought zone on this timeframe.

Forex trading is risky, do your own risk
eurjpy-d1-fxopen-investments-inc.png
 
What do you think about EURJPY on H1 timeframe below?

eurjpy-h1-fxopen-investments-inc.png


We can see if the price already crosses the MA line from below to up, it's mean the uptrend in hand-based indicators, meanwhile, RSI value 63, indicates the uptrend has not yet entered the overbought zone but is it will become a bullish signal for the long term?

Now read based on the chart pattern, if we draw a trendline from high to high, the trend still tendencies to downtrend based H1 timeframe, meanwhile in the daily timeframe, the trend tendencies to bearish, but sometimes price move high volatile and reach the high.

Forex trading is risky, do your own risk
 
EURJPY still move on previous range market, this movement is different with EURUSD that yesterday drops sharply. Usually, both pair has a positive correlation, which means if EURJPY rise then EURUSD also rise, and if EURJPY is a downtrend, then EURUSD also downtrend, but yesterday the correlation is broken, EURJPY moved on bullish but low volume, meanwhile, EURUSD drops sharply.

Based moving average indicator, the trend is still downtrend because the price is below the MA line, meanwhile, RSI level 34 is already out from the oversold zone, now on the H1 timeframe the price trying to head up the MA line.

Forex trading is risky, do your own risk
eurjpy-d1-fxopen-investments-inc.png
 
EURJPY drops the following the market, but not formed new low, on this week price movement on EURJPY move on range daily, swing high to swing low market, based RSI indicator right now the trading pair EURJPY already enter on oversold zone-based RSI value 24, the crucial level as oversold zone RSI is 30, but indeed sometimes trader modify the level to 20 as overbought level.

Now go to the H1 timeframe the most suitable for intraday trading, analysis, the price is now 128.528 and below the MA line, this is n downtrend based indicator, but you know if the indicator only follows the price, meanwhile RSI level 42 indicates a downtrend too but should be careful because based price action candlestick pattern, the price now at support zone.

Forex trading is risky, do your own risk
eurjpy-d1-fxopen-investments-inc.png
 
EURJPY rise on yesterday market, the price success to formed new high at 129.273, based on the daily timeframe, the prize now based on indicator RSI level 55 is signal for buy in this timeframe, meanwhile, the price still below MA line, indicates the trend still on down wave,

In the H4 timeframe, the price is above MA line, but RSI is already on overbought zone level at 79, meanwhile on H1 the price above the MA line indicates bullish on hand, and RSI value 67, is close to the overbought zone but not yet entering the zone

Forex trading is risky, do your own risk[/img]
eurjpy-d1-fxopen-investments-inc.png
 
EURJPY still move on correction phase, yesterday market the price rising to 129.500 but then drops again to 128.850, but the price cant continues to bearish, eventually price rising up again and now at 129.280 level price. If we look at the candle daily formed Doji candle, its means open price and the close price at the close line, Doji is an indecision candle, the market is still confused will going to where will move.

But the price trying to head up crossing the Ma line, and RSI level 55 indicates bullish more dominant based indicator, meanwhile go to the hourly timeframe the price already above MA line, and RSI level 67 its close to overbought zone.

Forex trading is risky, do your own risk
eurjpy-d1-fxopen-investments-inc.png
 
The price movement pair EURJPY yesterday on low volume, where the price only move small range on hourly timeframe, although the price already crosses MA line, but the overall movement still move on the line, RSI value 52 on daily timeframe indicates weighted to uptrend but still low percentage, meanwhile on H1 timeframe the price still move up and down between MA line, its consolidation phase.

Now price level at 129.236 below MA line and RSI value 32, already close to the oversold zone, scalping trading maybe will like to trying to get buy at low and sell at high based range and set stop loss accordingly.

Forex trading is risky, do your own risk
eurjpy-h4-fxopen-investments-inc.png
 
Back
Top Bottom