Profit / Loss Analysis

Marcellus8610

Well-known member
Correcting mistakes and analysing successful trades is a key trading process.
A very good practice is to write down your mistakes and successes so that you connect the subconscious mind to solve problems and remember successful actions.

Below I will analyse some of my trades, but this is not a template, you can post yours as you like, any is appreciated, even a lonely fact of your mistake or an analysis of other's mistakes and successes.
 
euro dollar trades analyse.png

1.
- MACD signal
- EMA 200 breakout
- According to the trend.
Stop loss is set below the resistance level. There is an alternative to exit the market in case of resistance at the 1.18100
2.
I rushed, not receiving a clear confirmation from main indicators, and at the same time did not foresee a possible movement through the 78.6% retracement level.
It was possible to set the stop loss closer, just above the key level 1.18600, that's breakout opens continued growth. If the uptrend were broken, there would be a risk of the fall completion at the key support 1.17950. The trade might have had to be closed prematurely with a small profit.
3.
- Clear MACD and RSI indicators confirmation
- The key high level 1.19060 was not broken
- Opening time frames is 4 hours.
The stop loss was moved to the profit at 1.18562 in case the key support at 1.18350 completes the decline.
4.
- Quite risky buy on the downtrend correction, near its support
- The key fact is 50% correction level was reached taking into account 4 hours.
- Strict stop loss level.
Close on touch EMA 50 but I see that I rushed and missed 24 pips.
5.
- Late but clear signal MACD
- EMA 50 touch
- correction depth is more than 50%
- confident downward.
Opening after a local upward correction and close by take profit before the key level 1.17300 and trend support.
 
oner.jpg


The chfjpy and eurjpy trades. Opened after MACD confirmation on the 4-hour chart. But I figured that the main daily trend should start a correction. The trend continued and trades were closed by stop loss. I took the risk of entering the market against the trend, at a time when there were no key resistance levels in the trend direction.

The first dollar yen trade was opened after MACD confirmation and visible divergence. During the first 24 hours, I could have taken a profit, but unfortunately, the EMA100 was not broken and the price went in the opposite direction. I should have exited at the moment the EMA100 was reached. The profit is too small.
I opened the second trade for this pair when the divergence was already more certain and the MACD confirmation became clearer. The EMA 100 was not broken, but retesting was evident. After its breakout, the trade confirmed its profitability.

The euro dollar trade. I entered the market after the key level 1.1635 was passed, but at the same time, the EMA 200 was still a strong obstacle. The stop loss level was reached after 1.16650 was tested again, and the moment the price reached it, I should have closed the trade with a profit.

The pound dollar is quite risky, but I understood that this is the upward trend resistance, I saw the MACD has been moving in the horizontal channel for a long time, and at the same time, the RSI has been above 70 for a long time.
And the yen trade was opened by clear confirmation from MACD. I did not close the loss during testing the 158.20 level, knowing that there might be a reversal, but at the same time, I did not risk waiting for the EMA 100 to be broken, since support 157.00 was already close.
 
analysetrades1111.jpg

Euro Dollar
Clear confirmation of MACD and EMA 100 crossing on the hourly chart. The trade closed by take profit I set above the key support 1.15130. The main disadvantage in this situation is a early exit when the clear signals to continue falling. I decided not to change the parameters of the trade and not to enter the market again, accepting the profit that had already been fixed.

Pound Dollar
1. Unconfirmed 100 EMA on 1 hour chart, and clear MACD crossing (finally EMA levels were passed and confirmed the direction). But the take profit was set above the support level 1.37120, so I could not get the maximum profit, at least up to 1.36700.
2. The situation is similar as for the euro dollar. These trades were opened at the same time and were traded using similar parameters.

Thus, these trades show inaccuracy that affects profits.
Exiting a profit trade early is a similar mistake as closing a losing trade late.
But this idea requires more attention, so I would expand on it in more detail later. If you have any thoughts, I will be glad to discuss.

latestNov11.png
 
This is what happens when no take profit is set. After the Euro Dollar dropped to its lowest in July 2020, I could close the trade with a much higher profit.
Conclusion: use take profit if possible and correctly assess the market prospects.

EURUSD take profit importance.png


trade EurUsd take profit.png
 
Trading in November showed my inaccuracies in the system and the win/loss rate is 57%. The Nov month profitability is 6.55%, which does not meet my monthly goal. I have already analysed and processed my mistakes in setting take profit, assessing possible risks, indicators data, etc. Read my thread (Profit/Loss analysis) to know more about trading history analysis.

Remember, post-trade analysis is just as important as before and during.

Now, I'm ready for the new month and the end of 2021.
Incidentally, I set a 2021 trading target of 150.00% and pointed to myfxbook. At the moment, I have reached 141.17% and I have one month to get to 150%
I'm sure I will make the end of the year really successful and show a result that will be an excellent motivation for me and the investors.
 

Attachments

  • myfxbook monthly analysis.png
    myfxbook monthly analysis.png
    10.6 KB · Views: 168
interesting! will you continue trade? what maxrisk this strategy can use for balance $1000 what lot can you use ?
is it possible to code EA from your trading ?
 
Today I will analyze the trade with the highest profitability in my account. It was made on February 10 on pound yen pair and reached to 75.5 points. This is not the highest number of points per trade in my account, but due to the lot, it was a record profit of $ 128,857.85.

The MACD indicators on the 30 minute and hour charts showed a buy signal, while the general trend direction on the four hour chart was consistent with this data, but the MACD just started to cross the signal line. The position of the chart above the EMA 200 and 100 lines also indicated the continuation of the uptrend. I set my take profit below the key resistance level of 157.700 and the trade was closed at 157.435, although I could have taken more profit if I believed the trend will expand and reach 158.0.

I was too cautious in this situation, but nevertheless, I completed the trading task and made a profit.
 

Attachments

  • pound yen profir max1.jpg
    pound yen profir max1.jpg
    8.9 KB · Views: 152
  • pound yen max profit.png
    pound yen max profit.png
    85 KB · Views: 155
Analysis of the mistake on July 12 Dollar Yen buy trade.
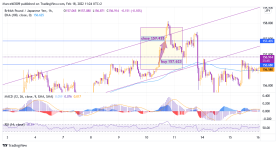
After a short-term decline on the 30-minute chart, I saw the possibility of a narrowing correction and further growth in line with the main trend. I planned to trade inside the correction and in case of breaking through its borders and the top of 137.750, hold the trade for maximum profit until the start of a new correction. Stop loss was set at 136.510, which was below the key level of 136.550. Thus, I saved trade against a trend reversal.
My very first mistake is the preference for indicator signals on smaller timeframes. My attention was focused on 30 minutes, while at 4 hours there was no clear position of indicators to buy, and on the hourly chart, there was a MACD in the sell at all.
The second mistake, which is quite controversial is the stop loss (usually controversial topic).
There are several options that could happen:
1. There is no stop loss, the trader chooses to hold the trade or not. There is a chance to get out of losses by showing patience and self-confidence and also chance to increase losses and .
2. There is a stop loss, but the trader sees that the market has reversed and closes the deal prematurely, without waiting for the stop loss, showing caution and self-confidence. (The one I chose)
3. There is a stop-loss, the trader waits until the last, until the trade reaches it or goes into profit. The trader shows confidence and patience.

On the chart, you can see that the touch of the stop-loss level was not clear and the market immediately reversed. This also leads to the conclusion that the stop-loss level is chosen with a slight inaccuracy. So setting a proper stop loss and holding the position without an early exit could have been profitable for me in the longer term, as you can see the market is already far higher.

In a conclusion I would like to note that even small inaccuracies can lead to losses, as well as the trader's behavior and confidence. It is important to find a balance between caution and confidence.
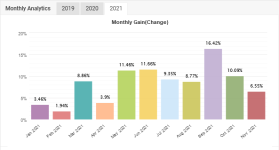
In my case, I made a choice in favor of caution, but further I worked through the mistakes and in the next trades I managed to achieve record high results.
Any trade, regardless of profit amount, brings you closer to success, because the most important thing is experience.

Dollar Yen trade July 12 (7xie89h).png


usd jpy buy trade July 12.png
 
July showed me some important points to work on and I will make a post about it at the beginning of August, because post-trading analysis is very important for me and is a base process in improving a trading system.
The July result is 7.8%, which is certainly a natural recession after a long three-month period with an average profitability of 13%.
However, this month there were quite huge trades. So, one of the trades got into the top 6 by growth percentage per trade (10.74%)
July full statement (elb4w7).jpg
 
Trading profit / loss analysis of 4 latest trades

Analysing trades over the past week has shown some interesting facts that I would like to share. These trades showed the imperfection of the trading system, and also, will allow me to continue working on the mistakes that I managed to find.
The list of trades:

Euro Franc (buy 0.98583)
Pound Yen (buy 164.677)
New Zealand dollar US dollar (sell 0.62533)
Euro Dollar (sell 1.02183)
July 4 trades (dNh9E).png


EURUSD sell trade was closed manually, at a price 1.01702.
Honestly, I regret that I closed the trade too early, because the EMA 100 and EMA 200 clearly showed a further fall, but I was afraid of a false break, as well as the impact of key support 1.01600 (which was also broken soon) and did not risk the funds that I have already been obtained. The opening of the trade was confirmed clearly according to the MACD data on the four-hour and hourly charts.
Euro Dollar July (Ju30bb).png


EURCHF buy was manually closed at 0.98215, although the stop loss was set lower at 0.98128.
This trade was based on a market analysis I posted here: Euro franc has tested the low of 0.98100 › LUX trading system
I got MACD confirmation on the 4-hour chart, and there were no prerequisites for a sell signal on the 1-hour chart. It was necessary to pay attention to the false breakdown of the EMA 200 on the hourly chart, although the EMA 100 was already below. Since I saw that the currency pair was going into a long fall according to the MACD, EMA and the formed down channel, I decided not to wait for the stop loss to be reached, which was the right decision, as you can see on the chart.
Euro Franc July (Jqpc4m).png


GBPJPY buy was manually closed at 164.918 after a long drawdown that I had to wait out.
I opened a trade according to the MACD data, after breaking through the EMA 200 on the hourly and four-hour charts. If I had held during July 27, I could have taken profits around 166.00, but I decided not to take risks and closed the trade before the key resistance at 165.100. It was a hasty decision, due to some tension that had arisen during the drawdown earlier. The MACD and EMA provided clear enough data to trade further, but I didn’t use them.
Pound Yen July (JRc87e).png


NZDUSD sell manually closed at 0.62269.
The main factor that pointed me in the direction of this trade was the divergence on the four hour chart. Also, I saw some consolidation in the EMA 200 area, which indicated that the market is not ready for a breakout and this is a sign of further uptrend correction. This is one of the few trades I have ever traded from the top of an uptrend knowing that it could be dangerous if the channel widened.
New Zeland Dollar July (Jhc9w).png
 
Euro dollar may continue to rise after a temporary correction. This prediction can be made according to a fairly clear MACD signal on the hourly chart. EMA 100 and EMA 200 indicators on the hourly and four-hour charts will help to finally decide on the further movement.
On the hourly, these lines are now resisting further growth and the price is right below them, making them key levels in the 1.0200 area. On the 4-hour chart, watch the EMA 100, which has already been tested at 1.02085 but has not yet been broken, and the EMA 200, which is obtaining more resistance power as the distance between the EMA lines narrows. Level 1.0283 is a key resistance point and the highest in the last month.
As for the MACD on the four-hour chart, there are no preconditions for growth so far, but everything can change if the price grows above 1.02085. Anyway there is no divergence on MACD.
If the option is not confirmed, then it is likely that the corrective trend that formed after the rapid fall to 1.0000 will be changed and we will see new attempts to beat the key levels of 1.01 and 1.00
Euro Dollar 03 Aug (7hYK4a).png
 
Euro Dollar narrows the amplitude channel.
A narrowing of the channel, or a decrease in the amplitude of market fluctuations, especially with a horizontal or close to horizontal movement, is always a very clear sign of further impulse that, like a tightened spring, will jump up or down.
This situation is now on the Euro Dollar, which has fallen to a critical value over the past month and is trying to get out of the depth called 1.000.
The correction, which began to move up with a quite confident amplitude, gave hope to become the beginning of a return at least to the values of 2017. But as we see now, the correctional channel has sharply reduced its amplitude.
Of course, on the Daily chart there is a clear MACD indicating further growth, which may lead to positive thoughts for the Euro. At the same time, a very weak, barely noticeable divergence appeared on the 4-hour chart. Price fluctuations repeatedly cross the EMA 100 level, but without reaching EMA 200, the chart goes down again. From this we can conclude that EMA 200 will be a key resistance level, and in case of an upward momentum, it will be an indicator of growth to 1.0340 and 1.6070. In case of fall, It will be more difficult to determine end level, due to several support levels (1.0140, 1.0125, 1.0100).
If the first level is broken by downward momentum, I would trade on the basis that the next one can become a key support and stop the fall.
Euro Dollar Aug 08 (Bdh89).png
 
The week of 15-19 August destroyed the monthly gains of the Euro Dollar.
After the correction to a maximum of 1.0368, the Euro dollar is again trying to return to the 1.000 value. It can be concluded already after the breakout of the EMA 100 and EMA 200 levels on the four-hour chart and the MACD signal line cross, which was shortly before.
At the moment, I do not see such a level of support that could prevent the reaching of the 1.000 mark.
The question that interests everyone the most is whether the fall will be lower. At this stage, I believe not, but I will not trade on this assumption without clear indicators.
I managed to take profit early in the week on the fall, but then I had to be careful not to hit one of the support levels formed by the breached upward correction trend.
Euro Dollar Aug 19 (eIcn0C3).png
 
Euro Dollar has reached its destination 1.000.
Now the interlocutory conclusions about the further movement are the following:
- on the MACD daily signal line indicates further decline, but more importantly, with equal price levels on July 14 and today, MACD levels are very different, which is a divergence or its beginning.
- in any case, the situation looks like that even if the key level of 1.000 is broken, in the long term, the market will return again above the key level 1.000.
- if the level of equality will be impregnable, then I would suggest the level of 1.0100 and 1.1830 as resistance levels and 1.02850 and 1.03650 as key resistance levels and possible boundaries of horizontal movement.
- the current fluctuations between 1.000 and 1.03650 can be the beginning of consolidation with the prospect of further breaking through key boundary levels.

Euro Dollar Aug 22 (Pnbcw3).png
 
The recent trading on the Euro Dollar was profitable with 40.9 pips. The currency pair began to rise within the corrective horizontal channel, so I opened buy trade and set the take profit at 1.00099 before the 1.0016 correction line and the trade confidently reached it and was closed at 1.00099.

This month, the trading plan was calcilated with a minimum profitability of 10%, and in just 3 trades I managed to achieve it.
Watch the results on my website LUX trading system › Forex trading › Trading results

August trading 25 (J9q3HGA).jpg
 
Back
Top Bottom