• Attention Forex Brokers, FX Companies & Hedge Funds.
    forum.forex is available for Acquisition
    Enquire

USDJPY Daily Analysis

FXGlory Ltd

Well-known member
USDJPY analysis for 16.01.2024


USDJPYmH4-FX.jpg

Time Zone: GMT +2
Time Frame: 4 Hours (H4)


Fundamental Analysis:

The USDJPY pair, like all forex currency pairs, is influenced by various macroeconomic factors, such as central bank policies, economic data releases, and geopolitical events. For the Japanese Yen, factors such as Japan's trade balance, Bank of Japan's monetary policy, and risk sentiment play a pivotal role. The U.S. dollar is affected by Federal Reserve policy, economic indicators, and global market sentiment. Any changes in these areas can cause significant price movements for USDJPY.
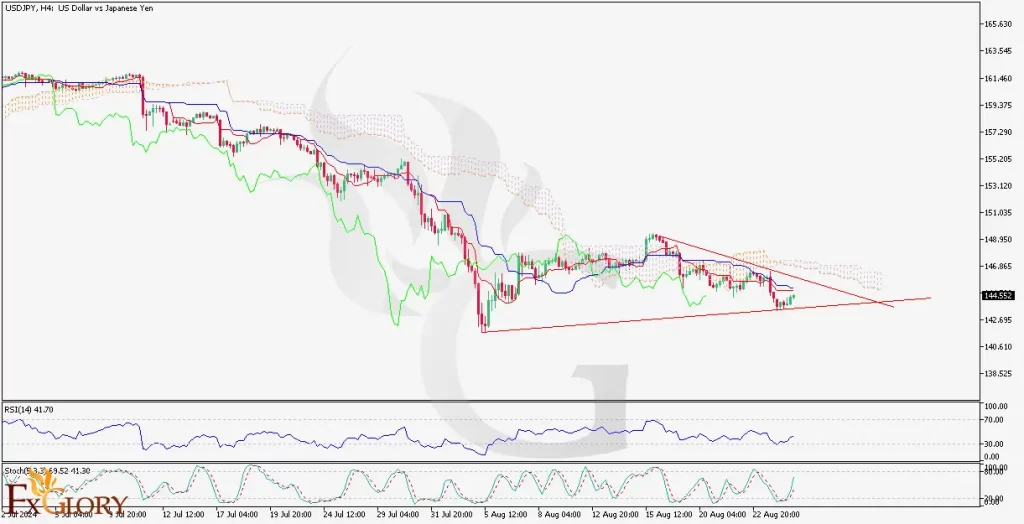

Price Action:
The H4 chart shows a recent recovery in price after a period of downward movement, indicating a potential shift in market sentiment. The price has formed a series of higher closes, which may suggest that bulls are gaining control. If this trend persists, it could lead to further upward momentum in the USDJPY pair.


Technical Indicators:
RSI (Relative Strength Index):
The RSI is around 61.6, which is slightly above the midpoint of 50, indicating a mild bullish momentum without being in the overbought territory.

MACD (Moving Average Convergence Divergence): The MACD histogram is positive, but the MACD line is below the signal line. This could suggest that while the bearish momentum is fading, the market has not turned fully bullish yet.

Ichimoku Cloud: The price is above the Ichimoku Cloud, which is typically a bullish signal. However, a close observation of the cloud's future projection suggests uncertainty in the trend's strength.

Parabolic SAR: The dots of the Parabolic SAR are below the price bars, which supports the bullish sentiment seen in the price action.


Support and Resistance Levels:
Support:
The price action shows a clear support level at the recent swing low around 141.50, which could act as a floor for future price dips.

Resistance: On the higher side, a resistance level can be identified near the recent high of around 146.00, which could pose a challenge for bullish movements.


Conclusion and Consideration:
The technical outlook for USDJPY on the H4 chart suggests a cautiously optimistic view for the bulls, with the price action and Parabolic SAR indicating an emerging bullish trend. However, the MACD and Ichimoku Cloud advise caution as they do not fully confirm a bullish reversal. Traders should monitor the key support and resistance levels, keeping an eye on macroeconomic developments that could affect the pair. It's prudent to set stop losses below the identified support level and take profits near resistance to manage potential risk.


Disclaimer: The above analysis is for educational purposes and should not be taken as investment advice. Traders should conduct their own research and risk assessment before making any trading decisions.


FXGlory
16.01.2024


FXGLORY-CRYPTO.gif
 
USDJPY analysis for 08.03.2024


Daily-Analysis---USDJPY---H4---08.03.jpg


Time Zone: GMT +2
Time Frame: 4 Hours (H4)


The USD/JPY technical analysis on the H4 chart for March 8th, 2024, reveals a persistent downtrend. Fundamental factors such as monetary policies and economic performances of both the U.S. and Japan continue to drive the pair, with the yen's safe-haven status playing a role in current market dynamics. The price is trading below the Ichimoku cloud and is hugging the lower Bollinger Band, signaling bearish momentum, confirmed by a MACD that is below its signal line. The RSI suggests oversold conditions, indicating a potential for a retracement. Immediate support is found at 147.530 with resistance at 148.180. Traders should exercise caution, stay informed on key economic releases, and employ rigorous risk management.


Disclaimer: This analysis is for informational purposes only and should not be taken as investment advice. It's crucial for traders to conduct their own research and consider their risk tolerance before trading.


Explore in-depth market insights and strategic trading tips by clicking here.


FXGlory
08.03.2024


FXGLORY.gif
 
USD/JPY daily chart analysis for 16.05.2024


USDJPY-H4-chart-market-technical-analysis-16.05.jpg


Time Zone: GMT +3
Time Frame: 4 Hours (H4)


Fundamental Analysis:


The USD-JPY chart analysis is influenced by economic indicators from both the U.S. and Japan. Recent Japanese economic data shows a contraction in GDP with the Preliminary GDP q/q at -0.5% versus the forecast of -0.3%. This indicates weaker economic activity, which generally weakens the JPY. Additionally, the GDP Price Index came in higher than expected at 3.6%, suggesting rising inflation which can pressure the Bank of Japan to adjust monetary policy. The Revised Industrial Production m/m came in below expectations, signaling weaker industrial output, which further weighs on the JPY.
In the U.S., high-impact news includes Jobless Claims with a forecast of 219k. A lower-than-expected figure would be positive for the USD as it indicates a stronger labor market. Additionally, the Building Permits and Philly Fed Manufacturing Index, both of medium impact, will provide insights into the housing market and manufacturing sector's health. The Industrial Production m/m data will also be crucial as it indicates the overall industrial output, and a figure higher than the forecast of 0.1% could further strengthen the USD. Positive economic indicators from the U.S. could support the USD, especially against the backdrop of weaker Japanese data.


Price Action:

On the H4 timeframe, the USD/JPY analysis shows a marked downtrend characterized by successive lower highs and lower lows. Recently, there has been a slight recovery with the formation of a bullish candle, suggesting a possible retracement or reversal in the short term. However, the broader trend remains downward as indicated by the overall movement and the positioning of the latest price below previous resistance levels.


Key Technical Indicators:

Bollinger Bands:
The bands have been widening recently, indicating increasing volatility. The price is currently near the lower band, which could suggest a potential rebound or consolidation at this level.

MACD: The MACD line is below the signal line and close to the zero line, signaling bearish momentum. However, the histogram shows a slight decrease in bearish momentum, which may suggest a possible slowdown in the downtrend.

RSI: The RSI is at 31.50 and moving upwards, indicating that the pair is close to oversold territory. This upward movement can signal a potential reversal or at least a pause in the current downtrend.


Support and Resistance:

Support:
Immediate support is around 153.760, with stronger support at 151.615, which aligns with recent lows.

Resistance: Initial resistance is around 154.475, with more significant resistance at 155.905, near the mid-range of the Bollinger Bands and the 50% Fibonacci retracement level.


Conclusion and Consideration:

The USD/JPY daily chart analysis is currently in a bearish trend on the H4 chart, with indicators showing potential for short-term support or a minor rebound. The fundamental usdjpy outlook favors the USD due to weaker Japanese economic data and potential positive U.S. economic reports. Traders should monitor key support and resistance levels closely, along with upcoming U.S. economic data releases, to identify potential trading opportunities and manage risk effectively. Given the current technical setup, cautious optimism for a short-term bounce could be warranted, but the overall bearish trend suggests remaining vigilant for further downside risks.


Disclaimer: The provided analysis is for informational purposes only and does not constitute investment advice. Traders should conduct their own research and analysis before making any trading decisions.


FxGlory
16.05.2024


image_2024-02-15_07_27_41.gif
 
USDJPY Daily Technical and Fundamental Analysis for 27.05.2024


USDJPY-H4-Daily-technical-and-fundamental-analysis-for--27.05.2024.jpg


Time Zone: GMT +3
Time Frame: 4 Hours (H4)


Fundamental Analysis:

The USD/JPY currency pair reflects the exchange rate between the US Dollar (USD) and the Japanese Yen (JPY). Today, the USD is expected to experience low liquidity due to a Bank Holiday in observance of Memorial Day. This typically leads to irregular volatility and less market activity, as US banks will be closed. On the other hand, significant volatility is anticipated for the JPY with Bank of Japan (BOJ) Governor Kazuo Ueda scheduled to speak. Traders will scrutinize his speech for clues on future monetary policy and interest rate changes, which could impact the value of the JPY currency.


Price Action:
The USDJPY pair analysis in the H4 timeframe shows a clear bullish trend. Over the past 10 days, the USD-JPY pair's price has been moving within an ascending channel. Recently, the price has been closer to the middle Bollinger Band line, suggesting a potential consolidation phase. The last five candles indicate a minor pullback, but the price remains within the upper half of the Bollinger Bands, maintaining a bullish stance.


Key Technical Indicators:
Bollinger Bands:
Analyzing the USDJPY's key technical indicators, the Bollinger Bands have been narrowing, which often precedes a period of low volatility followed by a breakout. The USD JPY's price has been moving in the upper half of the Bands for the last 10 days, and in the last five candles, it's getting closer to the middle line but remains above it, indicating ongoing bullish momentum albeit with caution for potential consolidation.

MACD (Moving Average Convergence Divergence): The MACD line is slightly above the signal line but the histogram shows decreasing momentum. This suggests that while the bullish trend is intact, the buying pressure may be weakening. Traders should watch for a potential bearish crossover which could indicate a shift in momentum.

RSI (Relative Strength Index): The RSI is currently at 59.42, below the overbought level of 70. This indicates that there is still room for the price to move higher before hitting overbought conditions. The RSI supports the ongoing bullish trend but suggests that the market is not yet overextended.


Support and Resistance:
Support:
Immediate support is located at 156.300, which aligns with the middle Bollinger Band and a recent price consolidation area.
Resistance: The nearest resistance level is at 157.600, which coincides with the upper boundary of the ascending channel and recent highs.


Conclusion and Consideration:
The USDJPY pair on the H4 chart forecast shows sustained bullish momentum, supported by the Bollinger Bands, MACD, and RSI indicators. The USDJPY's current price action within the ascending channel indicates that the bulls are still in control, though the narrowing Bollinger Bands and weakening MACD histogram suggest caution. Traders should be mindful of the potential for increased volatility due to the BOJ Governor's speech, which could impact the JPY significantly. Given the upcoming US Bank Holiday, liquidity might be low, leading to irregular volatility.


Disclaimer: The USD-JPY's provided analysis is for informational purposes only and does not constitute investment advice. Traders should conduct their own research and analysis of USDJPY before making any trading decisions. Market conditions can change rapidly, and it is essential to stay updated with the latest information.


FxGlory
27.05.2024


FXGLORY.gif
 
USDJPY Technical and Fundamental Analysis for 10.06.2024


USDJPY-H4- technical analysis on 10.06.2024.jpg


Time Zone: GMT +3
Time Frame: 4 Hours (H4)


Fundamental Analysis:


Today's economic releases for Japan include low-impact indicators such as Bank Lending y/y, Current Account, Final GDP Price Index y/y, Final GDP q/q, and Economy Watchers Sentiment. The USDJPY news analysis today suggests a generally stable economic environment with no significant surprises expected. The USD has no major releases today, indicating a relatively quiet day on the fundamental front, potentially leaving the currency pair more susceptible to technical movements and broader market sentiment.


Price Action:

On the H4 chart, the USDJPY forecast live today shows a recent recovery from a dip, moving upwards and breaking past several key levels. The pair is currently trading above the Ichimoku cloud, suggesting a bullish bias. The recent candles have higher highs and higher lows, indicating a potential continuation of this upward momentum.


Key Technical Indicators:

Ichimoku Cloud:
The price has broken above the cloud, with the Tenkan-sen (blue line) crossing above the Kijun-sen (red line), indicating a bullish trend. The leading span lines are showing a widening, which supports the bullish momentum.

Volume: There has been an increase in buying volume, which supports the recent upward price movement. This rise in volume suggests that the market participants are confident in the upward trend.

RSI (Relative Strength Index): The RSI is currently at 59.22, indicating moderate bullishness. It is not yet in the overbought territory, suggesting there is still room for further upside.


Support and Resistance:

Support Levels:
The immediate support level is at 155.782, which aligns with the lower boundary of the upward trend channel.

Resistance Levels: The key resistance level is at 157.033. A break above this level could indicate a continuation of the bullish trend.


Conclusion and Consideration:


The USDJPY fundamental analysis today on the H4 chart displays signs of a bullish reversal, supported by positive signals from the Ichimoku cloud and increasing volume. The RSI suggests room for further gains, while the trendlines provide clear levels to watch for support and resistance. Traders should monitor for a breakout above the 157.033 resistance level to confirm continued bullish momentum. Considering the moderate impact of today's economic releases from Japan, the market's technical aspects are likely to dominate the price action.


Disclaimer:
The provided analysis is for informational purposes only and does not constitute investment advice. Traders should conduct their own research and analysis before making any trading decisions.


FxGlory
10.06.2024


FXGLORY.gif
 
USDJPY H4 Technical and Fundamental Analysis


USDJPY-H4-Daily-Technical-and-Fundamental-Analysis-on-28.06.jpg


Time Zone: GMT +3
Time Frame: 4 Hours (H4)

Fundamental Analysis:

The USDJPY currency pair reflects the exchange rate between the US Dollar (USD) and the Japanese Yen (JPY). Today's upcoming USD news includes several low to medium impact events such as speeches by FOMC members and data on Personal Income and Spending. Notably, the Core PCE Price Index, forecasted at 0.1%, is a crucial inflation measure for the Fed. These indicators may provide insights into future US monetary policy, potentially influencing USD volatility. For JPY, the medium impact Tokyo Core CPI is forecasted at 2.0%, and other low impact data such as Unemployment Rate, Industrial Production, and Housing Starts are expected, which could affect the JPY's performance.


Price Action:
The USDJPY pair on the H4 timeframe is experiencing a clear bullish trend, with the price reaching its highest level since 2010. The price action shows a consistent upward movement as the candles move from the lower to the middle and now the upper Bollinger Bands, indicating strong bullish momentum. Recently, the price has been moving upwards steadily, supported by a positive trend in the market.

Key Technical Indicators:
Parabolic SAR:
The Parabolic SAR indicator shows the last three dots positioned below the candles, confirming a bullish trend. This placement indicates continued upward momentum, suggesting traders might look for buy opportunities as long as the dots remain under the price.
MACD: The MACD indicator shows the MACD line crossing above the signal line with the histogram displaying increasing momentum. This bullish crossover suggests strengthening upward momentum, which supports the ongoing bullish trend in the USDJPY pair.
Moving Averages: The short-term Moving Average (9-period, blue) has crossed above the long-term Moving Average (17-period, orange), both moving upwards. This crossover is a bullish signal, indicating that the short-term price trend is gaining strength relative to the long-term trend.


Support and Resistance:
Support:
Immediate support is located at 1.36600, aligning with a recent consolidation area and the middle Bollinger Band.
Resistance: The nearest resistance level is at 1.37481, which coincides with the 0.382 Fibonacci level and recent highs.


Conclusion and Consideration:
The USDJPY pair on the H4 chart shows sustained bullish momentum, supported by the Parabolic SAR, MACD, and Moving Averages indicators. The current price action within an ascending channel indicates that the bulls are in control, with potential further gains as indicated by the key technical indicators. However, traders should remain cautious due to potential increased volatility from the upcoming economic data releases and speeches from key officials. It is essential to monitor these events closely as they could significantly impact market conditions.


Disclaimer:
The provided analysis of USDJPY is for informational purposes only and does not constitute investment advice. Traders should conduct their own research and analysis before making any trading decisions. Market conditions can change rapidly, and staying updated with the latest information is crucial for informed trading decisions.


FXGlory
28.06.2024

FXGLORY-Crypto - Discount - .gif
 
USDJPY H4 Technical and Fundamental Analysis for 07.23.2024


Technical_and_Fundamental_Analysis_for_07-1024x522.jpg


Time Zone: GMT +3
Time Frame: 4 Hours (H4)


Fundamental Analysis:


The USD/JPY news analysis today is influenced by several fundamental factors, including economic indicators from the United States and Japan. For the USD, upcoming data from the National Association of Realtors and the Federal Reserve Bank of Richmond are crucial. Home resales, which reflect consumer confidence and economic health, can significantly impact the USD. Similarly, the Richmond Fed Index provides insights into manufacturing activity, which is vital for economic growth. For the JPY, the S&P Global Manufacturing PMI is a key indicator. This index reflects the health of the manufacturing sector and overall economic conditions in Japan.


Price Action:

The USD/JPY H4 chart, shows the pair's bearish trend, with recent price movements forming lower highs and lower lows. The USD/JPY pair, also known as the Gopher has its price currently trending below the Ichimoku Cloud, indicating a bearish sentiment. The pair has recently found support near 156.46 and resistance around 157.68. The formation of a descending channel suggests further downside potential unless there is a strong reversal signal.


Key Technical Indicators:

Ichimoku Cloud
:

The price is below the Ichimoku Cloud on USDJPY H4 chart, indicating a bearish trend. The Tenkan-sen is below the Kijun-sen , reinforcing the bearish outlook for this pair. The Chikou Span is also below the price, further confirming the bearish sentiment for USD against JPY.

MACD (Moving Average Convergence Divergence):

The MACD line is below the signal line, and the histogram is negative, indicating bearish momentum. The recent contraction of the histogram suggests a potential weakening of the bearish momentum.


Support and Resistance:

Support Levels:


The key support level is at 156.46, which has been tested multiple times and has held.

Resistance Levels:

The primary resistance level is at 157.68, with another significant level at 158.07.


Conclusion and Consideration:

The Gopher's technical analysis on the H4 chart exhibits a strong bearish trend supported by the Ichimoku Cloud and MACD indicators. The USD/JPY price action suggests a continuation of the downward movement unless a significant reversal signal occurs. Traders should watch for any breakouts above the resistance level of 157.68 or below the support level of 156.46 for potential trade opportunities. It's essential to monitor upcoming economic data releases for the USD and JPY, as these can impact the pair's direction. As always, employing proper risk management strategies, including stop losses, is crucial in this volatile market.


Disclaimer: The provided analysis is for informational purposes only and does not constitute investment advice. Traders should conduct their own research and analysis before making any trading decisions.


FXGlory
07.23.2024


FXGLORY.gif
 
Back
Top Bottom