FXGlory Ltd
Well-known member
USD/JPY Daily Technical and Fundamental Analysis for 05.27.2025

Time Zone: GMT +3
Time Frame: 4 Hours (H4)
Fundamental Analysis:
Today's fundamental landscape is marked by crucial events impacting both the USD and JPY. On the JPY front, traders are closely monitoring the Services Producer Price Index (SPPI) and the speech by BOJ Governor Kazuo Ueda. Any unexpected hawkishness in Governor Ueda's remarks could strengthen the Yen significantly. For USD, attention centers around Minneapolis Fed President Neel Kashkari's participation in a monetary policy panel and the latest figures on Durable Goods Orders. Hawkish signals or positive economic data from the U.S. are likely to support the Dollar.
Price Action:
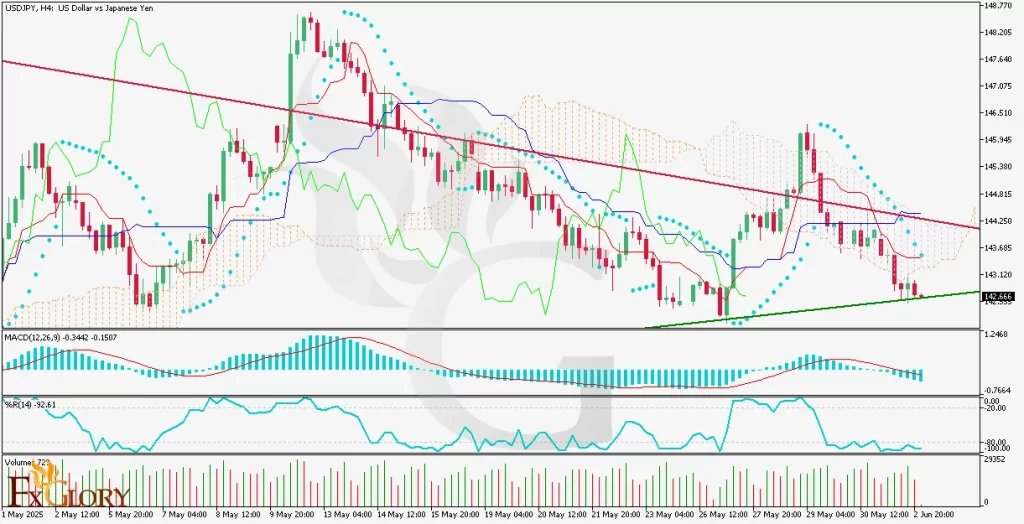
The USD-JPY pair on the H4 timeframe currently demonstrates a critical retest of the prevailing downtrend line, following a successful bounce from a clear support zone. The current price action suggests a pivotal moment; if the price convincingly breaks the downtrend line, subsequent bullish momentum could drive the price toward previously identified resistance zones marked clearly in red above the current level.
Key Technical Indicators:
Parabolic SAR: The indicator currently signals a bearish market sentiment, positioned above the recent candles. However, the approaching retest and potential breakout could signal a reversal of sentiment if the Parabolic SAR dots shift beneath the price candles.
Bollinger Bands: Bollinger Bands are moderately expanded, indicating sustained volatility. The price is interacting closely with the lower band, which may signal potential oversold conditions and an impending bullish reversal if the trend line is successfully breached.
MACD: The MACD histogram shows consistent negative bars, signaling ongoing bearish momentum. However, the narrowing bars indicate declining selling pressure, suggesting potential weakening bearish sentiment and an upcoming momentum shift toward bullish territory upon a successful breakout.
%R (Williams Percent Range): The %R indicator is deeply oversold at approximately -78.80. This significantly oversold condition suggests a potential bullish correction or reversal, especially if the price breaks the descending trend line resistance.
Support and Resistance:
Support: Immediate and significant support is clearly established at approximately 142.160. A break below this could see further bearish momentum.
Resistance: Immediate resistance is situated at approximately 143.155, with subsequent higher resistances at approximately 144.820 and 146.150.
Conclusion and Consideration:
The USDJPY H4 technical and fundamental analysis suggests cautious optimism for potential bullish developments, contingent on breaking the prevailing downtrend line. Traders must closely monitor today's economic releases and central bank speeches as they hold significant potential to drive volatility. Due to critical technical points and fundamental events today, risk management should be diligently applied to navigate potential sharp market movements.
Disclaimer: The analysis provided for USD /JPY is for informational purposes only and does not constitute investment advice. Traders are encouraged to perform their own analysis and research before making any trading decisions on USDJPY. Market conditions can change quickly, so staying informed with the latest data is essential.
FXGlory
05.27.2025

