FXOpen Trader
Well-known member
Gold Price Extends Decline, Oil Price Trimming Gains

Gold price struggled to clear $1,850 and started a fresh decline below $1,800. Crude oil price traded to a new multi-month high at $62.21 before starting a downside correction.
Important Takeaways for Gold and Oil
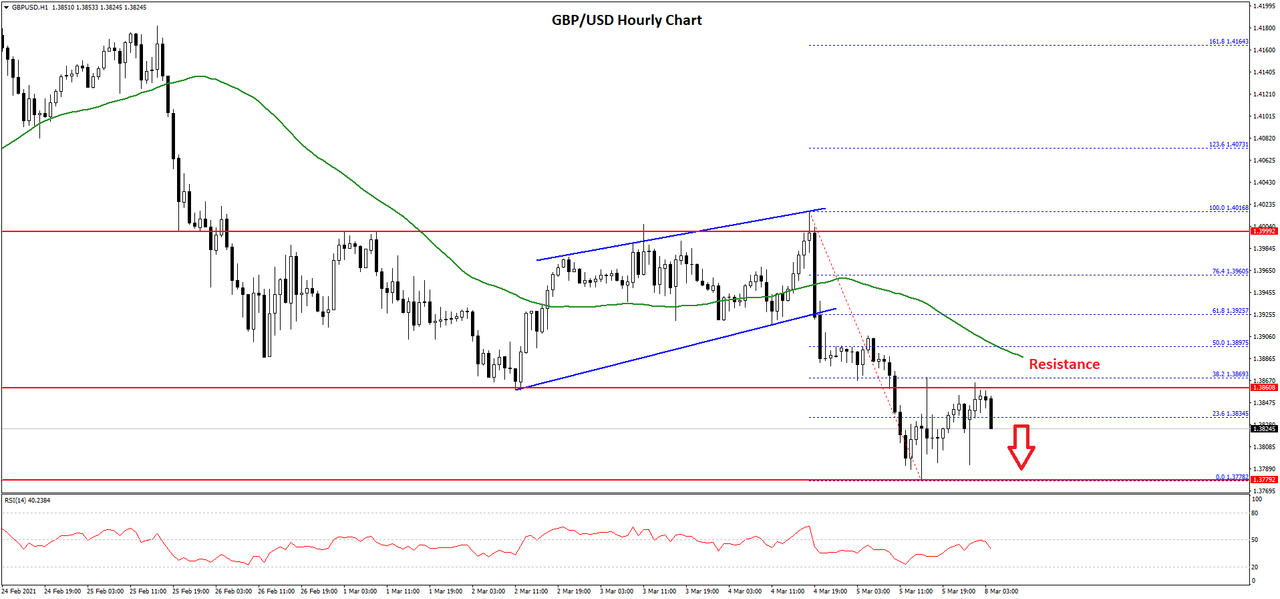
Gold Price Technical Analysis

Gold price failed to clear the $1,850 and $1,855 resistance levels against the US Dollar. As a result, there was a fresh decline below the $1,825 and $1,820 support levels.
The price gained bearish momentum below the $1,800 support and it even settled well below the 50 hourly simple moving average. It traded as low as $1,760 on FXOpen and it is currently consolidating losses.
An initial resistance on the upside is near the $1,775 level. It is close to the 23.6% Fib retracement level of the recent decline from the $1,826 swing high to $1,760 low.
The first major resistance is near the $1,780 level or the 50 hourly simple moving average. The next major resistance is near the $1,795 level. There is also a key bearish trend line forming with resistance near $1,795 on the hourly chart of gold.
The trend line resistance is close to the 50% Fib retracement level of the recent decline from the $1,826 swing high to $1,760 low. Therefore, the price might struggle to clear the $1,795 and $1,800 resistance levels in the near term.
On the downside, the first major support is near the $1,760 level. The next major support is near the $1,750 level. Any more losses might call for a move towards the $1,720 support level.
Read Full on FXOpen Company Blog...
Gold price struggled to clear $1,850 and started a fresh decline below $1,800. Crude oil price traded to a new multi-month high at $62.21 before starting a downside correction.
Important Takeaways for Gold and Oil
- Gold price failed to gain momentum and declined below $1,800 against the US Dollar.
- There is a key bearish trend line forming with resistance near $1,795 on the hourly chart of gold.
- Crude oil price traded to a new multi-month high near $62.21 before correcting lower.
- There was a break below a major bullish trend line with support near $61.20 on the hourly chart of XTI/USD.
Gold Price Technical Analysis
Gold price failed to clear the $1,850 and $1,855 resistance levels against the US Dollar. As a result, there was a fresh decline below the $1,825 and $1,820 support levels.
The price gained bearish momentum below the $1,800 support and it even settled well below the 50 hourly simple moving average. It traded as low as $1,760 on FXOpen and it is currently consolidating losses.
An initial resistance on the upside is near the $1,775 level. It is close to the 23.6% Fib retracement level of the recent decline from the $1,826 swing high to $1,760 low.
The first major resistance is near the $1,780 level or the 50 hourly simple moving average. The next major resistance is near the $1,795 level. There is also a key bearish trend line forming with resistance near $1,795 on the hourly chart of gold.
The trend line resistance is close to the 50% Fib retracement level of the recent decline from the $1,826 swing high to $1,760 low. Therefore, the price might struggle to clear the $1,795 and $1,800 resistance levels in the near term.
On the downside, the first major support is near the $1,760 level. The next major support is near the $1,750 level. Any more losses might call for a move towards the $1,720 support level.
Read Full on FXOpen Company Blog...