

Polakandil
Well-known member
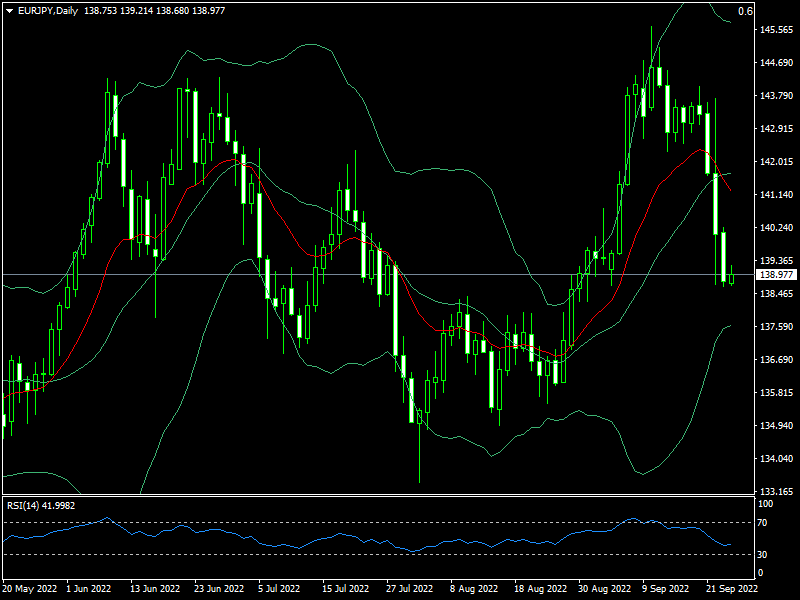
Monday has come, and today EURJPY price is 138.977 based MT4 trading platform FXOpen. There is no gap occurs seen in this pair.
In the daily timeframe, we can see the price now move below MA 14 and the middle band line. While the MA line seen crossing down the middle band line indicates a downtrend control of the market. However, the Bollinger band line seems to narrow after a large distance in high volatility last week. 168.668 still could be supported, and if breaks low could bring the price near the lower band of 137.612. RSi level 42 indicates a downtrend.
H1 timeframe EURJPY price move narrow trading range between the middle band and lower band indicates still a downtrend. Bollinger band narrow as a sideways market. While an RSI level of 41 indicates a downtrend market.
FXO Markets Ltd Disclaimer: CFDs are complex instruments and come with a high risk of losing your money.
In the daily timeframe, we can see the price now move below MA 14 and the middle band line. While the MA line seen crossing down the middle band line indicates a downtrend control of the market. However, the Bollinger band line seems to narrow after a large distance in high volatility last week. 168.668 still could be supported, and if breaks low could bring the price near the lower band of 137.612. RSi level 42 indicates a downtrend.
H1 timeframe EURJPY price move narrow trading range between the middle band and lower band indicates still a downtrend. Bollinger band narrow as a sideways market. While an RSI level of 41 indicates a downtrend market.
FXO Markets Ltd Disclaimer: CFDs are complex instruments and come with a high risk of losing your money.


