EURJPY daily technical analytics

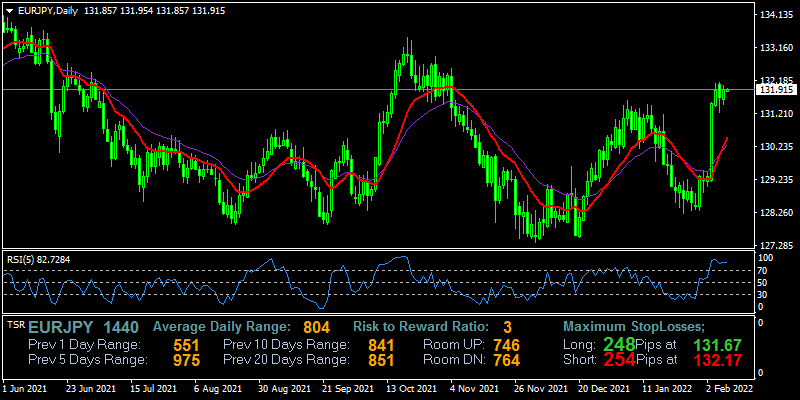
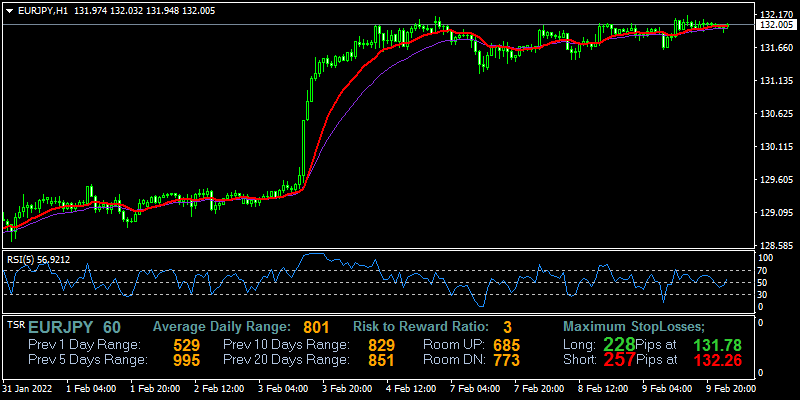
Yesterday market was very surprising, EURJPY soared in large movement and success to formed long body candle on the daily timeframe, after correction phase has ended, eventually, the price heading up and reach previous high at area 131.499, this is based on historical price is resistance zone level, now take a look on an hourly candlestick, the price starting on correction time, we know if the trend not always in one direction very strong, the demand will decrease where some of the investors might already take profit that increasing supply.

Based RSI indicator on H1, now the level is 85 indicates the price entered in an overbought area, this is become an early warning, although not always true, but price movement is very dynamic and easy to change.

Forex trading is risky, do your own risk
eurjpy-h1-fxopen-investments-inc.png
 
Monday morning, the market already open, but no big changes on the pair EURJPY, formation still like as in last week, the price already on the top price, and RSI already on overbought zone at level 88, no gap occurs although on Sunday there is some news but not influenced to this pair.

Go to H1 price movement now formed bulls market where te price above MA line, and RSI value 65, although in daily price already enter on overbought, but small wave still price rising, but trader need carefully if the rise only traps by smart money.

Forex trading is risky, do your own risk
eurjpy-d1-fxopen-investments-inc.png
 
Monday market, EURJPY formed bears candle, there is rejection at the resistance level and bring the price to a formed new low at 131.250, but after price drops then come buyer pressure trying to head up the price move to 131.644. the pattern now formed reversal pattern candle, RSI level also already on overbought zone level at 78.

Now back to the Hourly timeframe, the price in correction time, and flat condition where the price move between MA line up and down, meanwhile RSI level indicates 49 is downtrend starts.

Forex trading is risky, do your own risk
eurjpy-d1-fxopen-investments-inc.png
 
Tuesday market, the price of EURJPY formed bulls candle, after previous day the price formed bears candle, te price trying to heading up to resistance zone level, 132.101 seems still become solid resistance at the moment, the price still in consolidation zone, where trying to head up but still face rejection, meanwhile based RSI level, now price already entering in the overbought area but the buyer still trying to shift the price.

In hourly the price movement is still in a small range where the price zigzag around MA line, it still tends to bullish at the time of writing, but low volume trading, on this condition vigilance with smart money, they very smart to trap trader make wrong decision

Forex trading is risky, do your own risk
eurjpy-d1-fxopen-investments-inc.png
 
Wednesday market, EURJPY move formed bulls candle and reach previous high, seems the price trying to break out, but still lack the volume to head up the price higher. RSI value on daily already in overbought zone level 83, but still no signal reversal occurs at the moment.

Moving to hourly, now the price in a sideways market, where the candle formed flat condition, although in rising pressure, RSI value level 59 indicates the price tend to bullish, based indicator.

Forex trading is risky, do your own risk
eurjpy-h1-fxopen-investments-inc.png
 
The price of EURJPY on yesterday market figure out large movement and the price success to break high and continue to bullish, after the price move in correction phase before on few days on this week, the price very hard to drop but often faced rejection on resistance zone, after striving to breakout, eventually the price breakout and move even higher.

But need to become a consideration is now the daily candle appear pin bar candle, there are long-tail as a shadow on body candle, which means after price uptrend strongly, then come seller fight the trend and success make price drops, the signal usually used by a trader if this is reversal signal probably occurs. however pin bar signal is not always valid, sometimes the price still continues to the previous trend.

Forex and CFDs are complex instruments and come with a high risk of losing
your money.

eurjpy-d1-fxopen-investments-inc.png
 
EURJPY trading pair drops sharply on last week trading in Friday market, the price before able to reach the high 133.143, but then smart money work when the price already reaches high price, then push the price drops drastically, and landing to 130.179.

No gaps can be seen on this morning, the price looks normal movement, and there are corrections now at the small timeframe, based on the RSI indicator in the daily timeframe, now level at 45 indicates downtrend weighted on the moment, but MA 12 acts as a support zone, where the price touched the line and moving up.

Go to the H1 timeframe, the price formed bulls candle in a small wave, meanwhile, the price below MA line indicates a downtrend on the hand at the moment, meanwhile, RSI value 29 indicates the price enter in an oversold zone-based indicator.

Forex, CFDs are complex instruments and come with a high risk of losing
your money.

eurjpy-d1-fxopen-investments-inc.png
 
EURJPY price move on range price and formed bears candle yesterday, its price formed new low but then the price try to head up and bring the price landing to 130.603, the price success to cross MA line, where RSI level 39 indicates the downtrend based indicator.

Go to hourly timeframe, the price move below MA line and Mc Ginley indicator, based on the theory the trend is a downtrend, meanwhile RSI level in hourly shows 49, it downtrend but still in early stage, meanwhile the few last candles formed flat condition.

Forex, CFDs are complex instruments and come with a high risk of losing
your money.

eurjpy-d1-fxopen-investments-inc.png
 
EURJPY again shaped bulls candle after drops yesterday market, the price is very dynamic and sometimes changed in minutes, as before down market looks dominating the trend, but there are buyer increasing demand and make the pair try to head up. it is formed a higher high already.

RSI level 54 and the price above MA lines in a daily candle. means the uptrend-based signal indicator, Go to the H1 timeframe, now the price in correction, flat movement occurs on Asian session where market quite slow, based indicator MA the trend is bullish because the price above the MA line, while RSI also signaling uptrend now level 56.

Forex, CFDs are complex instruments and come with a high risk of losing
your money.

eurjpy-d1-fxopen-investments-inc.png
 
ERUJPY price yesterday formed an undecided market trend, the price up and down in bullish, and get pressure from the seller and formed Doji candle, now the price based RSI based level 56 indicates bullish in hand, meanwhile the price above MA line,

Go to the H1 timeframe, the price above MA line but in small trading volume, RSI level 64 indicates uptrend based indicator, the next possibility if the price continues to uptrend resistance level 131.878, support zone 131.100

Forex, CFDs are complex instruments and come with a high risk of losing
your money.

eurjpy-h4-fxopen-investments-inc.png
 
EURJPY, after consolidation on high zone price level, eventually the price back to drops and landed at a previous low price, now the price success to crossing MA line and McGinley indicator, meanwhile RSI level now 40 indicates downtrend based indicator. but because the zone is now at the support zone level, need to be careful because the market is very dynamic, possible to rebound and shaped a new high or reach a previous high.

Go to H1 timeframe now, the price below MA line and Mc. Ginley indicator line indicates a downtrend-based indicator, and RSI level 43 based indicator is a downtrend.

Forex, CFDs are complex instruments and come with a high risk of losing
your money.

eurjpy-d1-fxopen-investments-inc.png


Confirmed: FXOpen Is Your #1 ECN Broker
FXOpen-Is-Your--1-ECN-Broker_en.png
 
Monday has come, EURJPY tend to decline on this morning, there are gap occurs on this pair, but the price already cover the gap now, last week the pair success to formed new low, and expected the price still will continue to decline on this week,

But need to become considered if now RSI level 31 is already close to the oversold zone price level, although not always the signal will accurate all the time, but important to manage the risk when the indicator gives an alert.

From the weekly mirror, the price target support on lowest price level 127.327.

Forex, CFDs are complex instruments and come with a high risk of losing
your money.

eurjpy-d1-fxopen-investments-inc.png
 
Yesterday's market, the price drops and make new low, the price level 1.1300 already breakout, but if read previous history, the price still in high volatile market, and like as previous days, the price possible to rise again.

Now in daily timeframe price below MA line, means downtrend still dominant based indicator, while RSI level 47 also indicates downtrend based indicator, based stochastic level 20 now close to oversold zone level

Im hourly timeframe price below MA line and RSI level 39 indicates downtrend based indicator, while stochastic show 35 and sloping up indicates uptrend

Forex, CFDs are complex instruments and come with a high risk of losing
your money.

eurjpy-w1-fxopen-investments-inc.png
 
The trend still tend in a bearish market, but the candle pattern still remains wavy, where price drops and formed new low, but then reverse and enters the previous trading range, although the pattern formed high lower than previous high

Yesterday's price try to cross the MA line but then get pressure from the seller and make the price fall again, meanwhile based indicator the trend still in bearish formation, RSI level 43 indicates a downtrend-based indicator.
In hourly now the price above MA line, means the uptrend in short term, while RSI level 48 still in downtrend based theory indicator.

Forex, CFDs are complex instruments and come with a high risk of losing
your money.

eurjpy-d1-fxopen-investments-inc.png
 
EURJPY now price at 129.979, yesterday market the price try to reach previous high but in fact, the price still formed lower high, means based theory analysis, the trend actually still n downtrend market, but because every tick price movement worth the risk, trader smart-looking sell at high.

The daily timeframe the price now below MA 12 and Mc Ginley indicator, and RSI level 37 indicates bearish trading signal based indicator, its not yet enter oversold price zone-based RSI.

Go to hourly, the price below MA line and RSI already enter oversold zone level at 18,

Forex, CFDs are complex instruments and come with a high risk of losing
your money.

eurjpy-d1-fxopen-investments-inc.png
 
EURJPY eventually drops and formed a new low point yesterday, the news about the war between Russia vs Ukraina make a trigger the market beng a higher volatility market, included in this pair.

But after drops and formed new low, then there are pressure to take profit action and make the price formed pin bar candle, Analyze based MA line, the price now in a downtrend market but based RSI level now in oversold zone at level 15.

But the war maybe still will give a high impact on many financial markets including forex, crypto, stocks, etc,

Forex, CFDs are complex instruments and come with a high risk of losing
your money.

eurjpy-d1-fxopen-investments-inc.png
 
Monday morning, on EURJPY trading pair, has occurred long distance of gaps, where the open price starts below the close price on the past last week, the gap distance included very far, more than 200 pips, but usually, after gap occurred the price will move to recover the gap, let see what happen later, at present the price already move to cover the gap although not yet reach to covered.

Forex, CFDs are complex instruments and come with a high risk of losing
your money.

eurjpy-h1-fxopen-investments-inc.png
 
The price still not yet covered the gap, although the price trying to heap up, the high has not yet reached a close price where the gap starting, now the price below MA 12 and Mc Ginley indicator, in the hourly timeframe, meanwhile RSI level 43 indicates downtrend based indicator.

In long term perspective the price in near future probably still moves on the daily range market, where 128.000 still acts as support zone-based trading history, and resistance 130 based MA indicator that acts as dynamic support resistance.

Forex, CFDs are complex instruments and come with a high risk of losing
your money.

eurjpy-h1-fxopen-investments-inc.png
 
Daily timeframe now price move at support zone level based candlestick pattern history, yesterday price success to break low and formed new low, although not yet pass the support 127.300, the price bounce to rise. RSI level is now 23 as oversold zone level. although the price is below MA 12 and Mc Ginley indicator.

Go to hourly now price level below MA line and Mc Ginley indicator, but the price formed bullish formation, meanwhile RSI 46 level indicates the trend still in a downtrend.

Forex, CFDs are complex instruments and come with a high risk of losing
your money.

eurjpy-d1-fxopen-investments-inc.png
 
EURJPY yesterday's movement eventually closed in a bullish candle, after drops previous days, the price reversal and landing to hgh although the new high still below the previous high.

Based on indicator MA 12 now the price is below the line, which means downtrend controlling the market, meanwhile RSI value 35 indicates the price in downtrend not yet entering an oversold zone level.

Moves to hourly timeframe, now price above MA 12 and Mc Ginley indicator, means the tendencies current movement in an uptrend, but the price try to crossing the indicator line from the top, candle formation in bearish pattern now, meanwhile RSI level show 53 level, means above uptrend zone level based indicator, but the line sloping down.

Forex, CFDs are complex instruments and come with a high risk of losing
your money.

eurjpy-d1-fxopen-investments-inc.png
 
Back
Top Bottom