2023 Commodities Forecast by Solidecn.com

US30 - Chart of the day


Investor confidence in the US stock market has been declining since the latter half of the third quarter. This is partly due to the Federal Reserve's aggressive stance and Chairman Powell's statements, which have led to a rise in bond yields. In fact, 10-year treasury yields have hit a 16-year high of 4.54%. If the economy remains stable, these yields could continue to rise.

The stock market, including the Dow Jones Industrial Average (DJIIA or US30), is losing value as the risk-free rate increases and the economic growth outlook becomes uncertain. Major institutions like S&P and the Conference Board predict a slowdown in US GDP growth in 2024.

us30_4.png


There are also concerns about China's real estate market, particularly the default of Evergrande, and potential political crises in the US over the federal budget. A government shutdown, which has happened 18 times since 1977, could slow economic growth and delay the release of economic data. Credit rating agency Moody's warns that such events could lead to a downgrade of the US credit rating.

Looking at the US30 chart, the price is close to the 200-day Simple Moving Average (SMA200) level, which is around 33,932 points. The price has also fallen below the 100-day Simple Moving Average (SMA100) for the first time since May. If the price doesn't rebound, it could test the 23.6% Fibonacci retracement of the March 2020 upward wave at 32,400 points. Historically, the price's behavior around the SMA100 and SMA200 has often indicated buying opportunities or periods of weakness.​
 

Tesla


Tesla (TSLA.US) and other European automakers that import from China into the EU will be part of an investigation into whether the electric vehicle industry receives unfair subsidies, the Financial Times reported, citing Valdis Dombrovskis, the EU's executive vice president.

The EU is "open to competition" in the electric vehicle sector, the official added, but "competition must be fair," adding that other countries have already imposed tariffs on electric vehicles from China. The investigation will cover all companies (not just Chinese) that receive subsidies on the production side.

tesla.png


This situation for Tesla (TSLA.US) itself could prove problematic, as nearly 20% of all the brand's electric vehicles sold in Europe are manufactured in China, including at a factory in Shanghai.​
 

Silver

Silver prices have been rising strongly, boosted by lower bond yields, a weaker US dollar, gains in the Chinese market, and a generally better mood in global markets.

The future looks bright for silver due to increased demand from the solar power industry and limited supply from major mines. ANZ Research predicts that by 2025, solar power will increase silver demand to 225 million ounces, up from an estimated 161 million ounces in 2023.

Today's rise in silver prices is mainly due to global factors and speculators covering their short positions, expecting silver prices to fall further. Silver has been under pressure for several days due to the strong dollar and high yields.

As markets become more confident that interest rates may have reached their peak, some analysts predict that silver prices will rise if monetary policy is gradually relaxed worldwide.

Will solar energy increase the demand for silver?

According to the Silver Institute, the silver market had a deficit of 237.7 million ounces in 2022, and this deficit is expected to continue in the coming years. However, large inventories and holdings of individuals and investors are filling this gap.

Silver Institute analysts say that demand for silver from photovoltaic (PV) cells used in solar panels has tripled over the past eight years to 160 million ounces. This represents 14% of total silver demand in 2023, compared to 5% in 2014. There is a risk that the amount of silver used in panels could be reduced if prices become too high for producers, but there is limited scope for reduction given the usefulness of the metal.

silver-1.png


Looking at the silver price chart, we can see that the price has risen above the 38.2% Fibonacci retracement of the upward trend from March 2020 and is now close to surpassing all three key moving averages, which are almost at the same level of $23.4 per ounce. If prices break above these averages, it could signal a potential rebound towards $25.7, where we see the 23.6% Fibonacci level. On a daily basis, despite today's strong increases, the RSI indicator is just over 53 points. The area around $22.5 has been a strong support for buyers in recent months - a possible decline around this level could signal longer-term weakness.

silver-2.png


Looking at the SILVER chart and the dollar index (USDIDX, gold color), we see that a strong upward impulse has re-emerged as the dollar reduces the recent very strong gains. At the same time, the trend line has been maintained.​
 

US100 - Chart of the days


US index futures opened higher following the weekend, with US100 jumping almost 0.7% at futures trade launch. This is a response to US Congress passing a stopgap funding bill over the weekend that will ensure financing for the US government for 45 days. This means that a US government shutdown has been avoided, at least for now. US politicians will now attempt to work out a more enduring agreement before the new deadline passes in mid-November.

While the US government shutdown was never seen as a significant, plausible risk for the markets and discussions dragging close to the deadline were mostly attempts to win as many concessions from the other side as possible, some weakness could be seen on Wall Street on Friday, signaling that some investors positioned for a potential lack of agreement, and today's jump can be viewed as a retracement of that move.

US100-Chart-of-the-day.png


Taking a look at the Nasdaq-100 futures chart (US100) at D1 interval, we can see that today's bounce plays well into the overall technical bullish setup. Index continues to climb following a bounce off the lower limit of the Overbalance structure. Bulls are trying to push the index back above the psychological 15,000 pts area today. Should they succeed, the way towards the major near-term resistance ranging below the 15,650 pts would be left open.​
 

Tesla


Wall Street is expected to open lower, with futures indices erasing earlier gains. Investors are shifting towards lower-risk positions as US 10-year bond yields surge and the dollar strengthens.

Final PMI data indicates a contraction phase in major economies despite better than expected results from Europe. US Manufacturing PMI improved due to increased employment and better supply availability, but inflation concerns persist due to rising producers' costs.

US ISM Manufacturing PMI shows contraction for the 11th month in a row, despite some recovery signs. While demand remains soft, production improved, and suppliers retained capacity. Discrepancies between ISM and PMI prices underscore the rapidly changing environment.

tesla_2.png


Goldman warns of the impact of rising rates on US corporate profits. Kevin McCarthy faces pressure from Joe Biden to fund Ukraine and from Matt Gaetz to cut government spending. Bill Ackman plans to pursue a deal with Elon Musk's X through Pershing Square's SPARC.

The US500 index is trading at 4320 points, down 0.20%, with selling pressure preventing recovery. It's set to retest the critical 4300 support zone.

Tesla's shares fell 4.0% as Q3 deliveries and production fell short of estimates. The company delivered 435,059 vehicles and produced 430,488, attributing the decline to planned factory upgrades. However, Tesla's 2023 volume target of 1.8 million vehicles remains unchanged.


Bitcoin is better than digital Gold


Bitcoin and gold are both seen as valuable assets, according to a recent report by Matrixport. Bitcoin's popularity has surged due to its digital nature, making it a desirable asset. Currently, Bitcoin's market value is $540 billion, which is about 10.8% of the total value of physical gold. Gold ETFs, on the other hand, are worth $200 billion.

The report suggests that if the U.S. Securities and Exchange Commission (SEC) approves a Bitcoin ETF, it could attract an investment of $20 - $30 billion. This could potentially cause a significant increase in Bitcoin's value. However, the SEC has been slow in making a decision on this matter and has postponed all new applications until October. Despite this, the crypto market remains optimistic about the potential influx of mainstream investment.

Interestingly, Bitcoin has an advantage over gold. You can remember your private keys, which means there's no risk of them being taken away.

Matrixport's head of research, Markus Thielen, pointed out that storing wealth in gold is becoming less popular in today's digital age. It also has limitations when it comes to international transactions. In contrast, Bitcoin allows for quick and discreet transfers of value across borders.

In conclusion, given the current technological advancements, Bitcoin serves two main purposes. It acts as a store of value similar to gold and as a speculative financial asset.​
 

XAUUSD Technical Analysis


Our XAUUSD analysis shows Gold (XAU) is in a correction phase against the US Dollar (USD). It's moving below the Ichimoku Cloud, indicating a bearish trend. We expect a rise to 1860 before falling to 1775. This could change with a breakout above 1885 or below 1875. These are predictions based on current trends and technical analysis.

XAUUSD_2023-10-09_20-32-44.png
 
Crude Oil Market Analysis

Crude Oil rose from $80, which is in the Ichimoku cloud, and is currently testing the broken support around $84. Bears successfully broke out of the channel and the outlook of the current market is bearish, with the RSI hovering below the 50 line in the Crude Oil daily chart.

WTI-2023-10-12-17-47-23-b7293.png


The bearish bias of Crude oil is more vivid in the 4H chart, as the black gold is trading below the pivot and within the bearish channel.

WTI-2023-10-12-17-47-34-67c22.png


With the price holding below the 84.36 pivot, we expect the decline in Crude oil to continue and target the 80 support followed by 77.86.

On the flip side, if the oil price closes above the bearish channel in the 4H chart, the short-term bearish scenario will be over, and bulls are likely to drive up the price to test the daily resistance around $88 in upcoming sessions.​
 

XAUUSD


Gold prices are looking to increase as we move into early European trading hours. With a rise of over 2.4 percent, the gold to US dollar rate (XAUUSD) is on track for its best week since mid-March. This comes as recent comments from the Federal Reserve have been increasingly cautious.

gold-solidecn_1.png


If we look at the daily chart, the first level of resistance seems to be at 1884.89, a key point from August. Resistance levels are prices at which sellers are expected to enter the market in sufficient numbers to take control from buyers.

Just above that, gold will encounter the 50- and 200-day moving averages. A moving average is a commonly used indicator in technical analysis that helps smooth out price action by filtering out the "noise" from random short-term price fluctuations.

There was a bearish crossover in September, which suggested a general downward trend. A bearish crossover occurs when a short-term moving average crosses below a long-term moving average, signaling potential downward price movement.

So, XAUUSD is facing important resistance levels as we approach the weekend. If prices start to fall, the midpoint of the Fibonacci retracement level is at 1848.37, followed by the 1804.78 – 1815.30 point. Fibonacci retracement levels are horizontal lines that indicate where support and resistance are likely to occur. They are based on Fibonacci numbers, each level is associated with a percentage, showing how much of a prior move the price has retraced.​
 

In-Depth Analysis of XAGUSD


Silver prices, much like their golden counterpart, are experiencing a similar trend. The XAGUSD pair has seen an impressive surge this week, with an increase of nearly 2 percent. This level of aggressive push in the value of this precious metal hasn't been witnessed since mid-September.

Looking ahead, the immediate resistance that the XAGUSD pair might face is twofold. Firstly, it's the previous rising range of support that was observed in September. Secondly, it's the 38.2% Fibonacci retracement level which stands at 22.85. These resistance levels could potentially hold their ground, thereby reinstating the broader bearish bias that has been prevalent since early May.

silver-solidecn.png


However, in the event of a downward turn, the immediate support seems to be situated at the midpoint of the Fibonacci retracement, which is at 21.84. If losses extend beyond this point, the focus then shifts to the 61.8% level at 20.83.

A clearance below this latter level could potentially open up the possibility for a resumption of the downtrend. This would be a significant development as it would indicate a continuation of the bearish bias in the market.

In conclusion, while silver prices have shown a promising increase this week, there are several key resistance and support levels to watch out for. These levels will play a crucial role in determining whether the current uptrend can sustain itself or if a return to the bearish bias is on the horizon.​
 

Frax's New Product sFRAX: A Game Changer in Decentralized Finance


Frax, a decentralized finance protocol, has introduced a new product called sFRAX. This product allows holders of Frax's stablecoin, FRAX, to earn interest at a rate similar to the U.S. Federal Reserve's interest rate on reserve balances, which is currently around 5.4%. The product started with an annual percentage yield (APY) of 10%, but it will eventually match the Federal Reserve's rate.

Since its launch, over 150 users have invested more than $35 million in sFRAX. This has caused the price of Frax's governance token, FXS, to increase by 7% to $5.66, although it has since dropped slightly to $5.49.

Meanwhile, lending protocol MakerDAO has been successful in attracting interest in the U.S., investing over $2 billion in short-term bonds since February 2022 and offering a 5% savings rate on its own stablecoin, DAI. This has led to a significant increase in the value of its token, MKR, which has risen by over 168% this year.

In comparison, FXS has only increased by 32% this year. However, some people in the crypto community believe that FXS will soon catch up with MKR.​
 
USDINDEX

In the wake of the escalating conflict in the Middle East, secure assets like gold and the US Dollar have seen a significant rise.

The intensifying conflict in the Middle East has led to a notable increase in the value of secure assets such as gold and the US Dollar. The situation on the Israel-Lebanon border has worsened, resulting in over 2,000 civilian casualties in the Gaza Strip. In an attempt to alleviate the situation, the US has initiated covert negotiations with Iran. However, the possibility of a direct clash between Israel and Iran, a major backer of Hamas, is causing alarm. In tandem with these US-Iran discussions, oil prices have skyrocketed due to fears of impending oil sanctions. According to Bloomberg Economists, this situation could drive oil prices up to $150, potentially pushing the global economy into a recession.

usdindex.png


The US Dollar is maintaining its upward trajectory, driven by strong inflation figures from the US. The rising geopolitical unrest in the Middle East has also strengthened the appeal of the greenback as a preferred safe-haven asset. Although the Dollar's overall trend is subject to potential swings, the forthcoming speech by Fed Chairman Jerome Powell is a significant event to watch.

Currently, the Dollar Index is experiencing an uptrend while it tests the resistance level. However, the MACD indicates a decrease in bullish momentum, and with the RSI at 59, it suggests that the index may undergo a technical correction as the RSI has sharply withdrawn from overbought conditions.

Resistance levels: 106.60, 107.15.
Support levels: 105.65, 104.80.​
 
USDSEK Analysis: The Ultimate Guide to October 2023

The pair recently broke above the 10.84 resistance level, a significant milestone in its upward trajectory. This break was tested when the Stochastic oscillator signaled that the USDSEK might be overbought. However, with the RSI indicator remaining above the 50 level and far from the overbought area, it suggests a decent bid for buyers at the 10.84 support level.

USDSEK-2023-10-16-12-34-51-87b63.png


To further confirm this scenario, we've zoomed into the USDSEK 4H chart. Despite attempts by the bulls to break out of the bearish channel, the USDSEK price has returned inside the channel. In this USDSEK analysis, we recommend traders to exercise patience at this level. Although the currency pair's main trend is bullish in the weekly chart, it's currently in a declining channel in the 4H chart.

USDSEK-2023-10-16-12-45-53-c24ee.png


If the bears manage to close below the blue bullish channel, we anticipate that the USDSEK price will decline to the middle line of the 4H bearish channel (shown in black), followed by reaching the 10.77 support level. On the other hand, if the bulls on the USDSEK manage to break out of the blue bullish channel in the 4H chart, we predict that the price of the pair would surge towards a target of 11.123.​

Source
 
Bitcoin

Recently, we observed a notable event in the BTCUSD market trends. The BTCUSD broke out of the bearish channel, surpassing the $27,237 pivot with a strong bullish candle in the 4-hour chart. As of now, it's testing the $27,952 resistance, indicating a potential shift in market dynamics.

Our BTCUSD Analysis wouldn't be complete without examining the technical indicators. Upon scrutinizing the BTCUSD 4-hour chart, we noticed a divergence in the Relative Strength Index (RSI) indicator. Both the RSI and the stochastic oscillator are hovering in the over-bought zone. This observation is crucial as it often signals a potential reversal in market trends.

BTCUSD-2023-10-16-15-23-57-fba36.png


Given the current state of overbought conditions, our BTCUSD Analysis suggests a cool down in the bullish momentum. It's likely that the bears will step in to correct the recent rise of BTCUSD. This correction phase is a common occurrence in financial markets after a significant price increase and is often seen as a healthy sign for long-term market stability.

We anticipate that BTCUSD might test the Ichimoku cloud before further rise. The Ichimoku cloud is a collection of technical indicators that show levels of support and resistance, as well as momentum and trend direction. It's an essential tool in our BTCUSD Analysis toolkit.​

Source
 
SOLUSD Analysis

Amidst the ETF rumors, Solana's price experienced a significant surge, peaking at $27, a trend that was mirrored by other cryptocurrencies. This spike in SOLUSD's price resulted in it reaching the $24 - $27 resistance zone, causing both the RSI indicator and Stochastic oscillator to enter the overbought region.

SOLUSD-2023-10-17-09-45-35-73581.png


Technical indicators suggest an impending market correction. With SOLUSD breaking the upper band of the Bollinger Bands, it's anticipated that Solana will correct its recent gains and potentially decline to $22.4, aligning with the middle band of the Bollinger Bands.

SOLUSD-2023-10-17-09-46-08-34baf.png


This scenario is contingent on SOLUSD closing below the middle line of the Bollinger Bands on the 1-hour chart, which is currently around $23.5. If bearish momentum is observed, we can expect SOLUSD's bearish trend to persist, with initial targets set at $23.24, followed by the $22 pivot point.​

Source
 
Gold

Gold (XAUUSD) did great last week, reaching a high of 1930/32. It managed to hold a small resistance at 1940/45 all morning before breaking above 1950. This gave another buy signal aiming for 1962/65. We saw the day's high right there, and things still look good even though it's quite overbought. I don't see any reason to sell yet.

image-638332995071670586.png


If it breaks above 1965, it could aim for 1970/75 & 1980/82, maybe even up to 1986/88. I'll keep an eye out for any sell signals.

There's solid support at 1938/33. If you're going long, you should put your stops below 1928.​
 

Gold Forecast October with Swing Trading


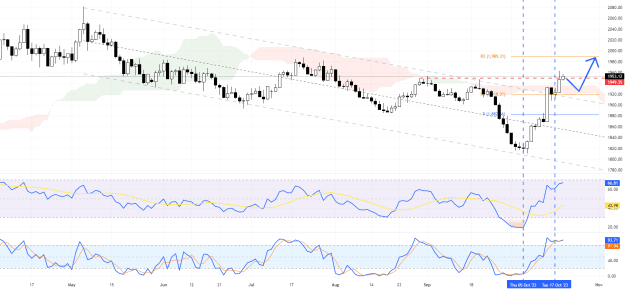
The XAUUSD pair has been on an upward trajectory since October 25. This bullish trend was marked by a significant breakout from the bearish channel, which was subsequently tested on October 17. Currently, the yellow metal is not just surpassing its September high of $1,949 resistance, but also trading above the Ichimoku cloud. The position above the Ichimoku cloud is a strong indicator of a bullish bias in the market.

This suggests that investors are optimistic about gold's future performance and are willing to buy at current prices in anticipation of further increases.

Click to EnlargeName: XAUUSD_2023-10-19_16-53-29_ace2c.pngSize: 58 KB

In terms of technical indicators, the Stochastic oscillator is currently in the overbought zone. This typically suggests that the asset has been bought excessively and could be due for a price correction. However, it's worth noting that the Relative Strength Index (RSI), another momentum indicator, still has some room before reaching the overbought area. This divergence between the two indicators suggests that while gold may be overbought according to the Stochastic oscillator, there may still be some upward momentum left according to the RSI.

Given these conditions, there is potential for gold's price to rise higher and target the $1,989 resistance level. However, it's also possible that we might see a retest of the $1,920 level before any further gains are made. This could provide an opportunity for investors who missed out on the initial breakout to enter at a more favorable price point.

Final Word

In conclusion to our gold forecast October, while gold's current bullish trend and its position above the Ichimoku cloud suggest potential for further gains, investors should also be mindful of technical indicators such as the Stochastic oscillator and RSI which suggest that a price correction could be on the horizon. (source)​
 
EURSGD

In a significant development, the EURSGD pair has successfully broken out of the bearish channel, closing above the crucial 1.45 pivot point on the daily chart. This shift is further confirmed by the RSI indicator, which has flipped above the 50 line, indicating a bullish bias.

Given these factors, it's anticipated that the EURSGD pair will continue its upward trajectory, potentially gaining value and reaching the R1 support level around the 1.461 area.

EURSGD-2023-10-20-00-29-05-c346e.png


The pivot point serves as a strong support for the bullish scenario in the EURSGD market. However, if the bears manage to push the EURSGD pair to close below this level, it could signal a continuation of the decline. The next target for the pair would be the S1 support level, situated around the 1.434 area. Keep an eye on these key levels in the EURSGD market for potential trading opportunities.​

Source
 

XRPUSD Technical Analysis: Ripple's Breakout and Market Volatility​


Ripple (XRP) recently experienced a significant breakout, surpassing the 0.53064 mark. This event led to a surge in momentum indicators, with both the Relative Strength Index (RSI) and Stochastic Oscillator entering the overbought area. This is a clear indication of strong buying pressure and heightened investor interest.

The recent news surrounding Ripple has added an extra layer of volatility to the market. It's important to note that market volatility can present both opportunities and risks for traders. High volatility often leads to larger price swings, which can result in higher profits or losses.

XRPUSD-2023-10-20-09-31-09-b15a4.png


Bearish traders have exerted pressure on the XRPUSD pair, resulting in the formation of a long-wick candlestick pattern. This pattern is often seen as a sign of a potential price reversal. The 0.5306 level is playing a crucial role as the main support for the recent gains. As long as the XRP price remains above this level, there's a valid outlook for bullish traders to push the price towards 0.5488.

However, if bearish traders manage to close the XRP price below 0.5063, it could trigger a price drop targeting 0.477. This scenario underlines the importance of key support and resistance levels in determining potential market movements.

In conclusion, while Ripple's recent breakout and the subsequent market volatility present potential opportunities for traders, it's crucial to closely monitor key technical indicators and market news to make informed trading decisions.​

Source
 

Gold


Gold prices have stopped rising just below a five-month high on Monday. The rapid increase in prices slowed down as it got close to the $2000 mark. After a strong push back on Friday, it's clear that the $2000 area is a big hurdle. This has led traders to take some profits from the over 7% increase in the last two weeks.

gold-solidecn.png


Daily indicators suggest that this pause was expected, although the slight drop shows that buyers are still interested in pushing the price above $2000.

Due to unrest in the Middle East, traders are looking for safer options. The possibility of conflict escalating increases the demand for gold, which continues to drive up its price.

The slight drop in price has stabilized above the rising 5-day moving average ($1960). Any further drops are expected to stay above $1945 (the halfway point between $2080 and $1810), indicating a normal correction and keeping the overall upward trend intact.​
 
Back
Top Bottom